inkscapeMadeEasy_Base
Base class for extensions.
This class extends the inkex.Effect class by adding several basic functions to help manipulating inkscape elements. All extensions should inherit this class.
Important
Unless explicitly mentioned, all the code snippet presented in this section assume you are using inkscapeMadeEasy as presented in the Minimal example section and your are within the scope of your extension class and, therefore, can use self.[SOME_FUNCTION].
Note
in all examples, assume inkscapeMadeEasy modules are imported with the following aliases
1import inkscapeMadeEasy.inkscapeMadeEasy_Base as inkBase
2import inkscapeMadeEasy.inkscapeMadeEasy_Draw as inkDraw
3import inkscapeMadeEasy.inkscapeMadeEasy_Plot as inkPlot
- class inkscapeMadeEasy_Base.inkscapeMadeEasy[source]
Bases:
Effect- bool(valueStr)[source]
ArgParser function to turn a boolean string into a python boolean
- Parameters:
valueStr (string) – string representing a boolean. Valid values: ‘true’,’false’ with any letter capitalization
- Returns:
boolean value
- Return type:
bool
Note
This function was copied from inkex.utils.py to avoid having to import inkex.py in your project just to use inkex.Boolean in
arg_parser.add_argument. You can pass this function inarg_parser.add_argumentmethod when dealing with boolean values. See Minimal example section for a good example.Example
In your
__init__function,arg_parser.add_argumentrequires a callable to convert string to bool when dealing with bool variables. See Minimal example section for a good example.>>> self.arg_parser.add_argument("--boolVariable", type=self.bool, dest="boolVariable", default=False)
- displayMsg(msg)[source]
Display a message to the user.
- Parameters:
msg (string) – message
- Returns:
nothing
- Return type:
- createEmptySVG(fileName)[source]
Creates an empty svg file.
Note
The empty file does not replace the current opened document
- Parameters:
fileName – valid filename and path
- Returns:
nothing
- Return type:
- getBasicLatexPackagesFile()[source]
Return the full path of the
basicLatexPackages.texfile with commonly used Latex packagesThe default contents of the
basicLatexPackages.texis:\usepackage{amsmath,amsthm,amsbsy,amsfonts,amssymb} \usepackage[per=slash]{siunitx} \usepackage{steinmetz}
- Returns:
Full path of the file with commonly used Latex packages
- Return type:
string
Note
You can add other packages to the file
basicLatexPackages.tex.
- Dump(obj, file='./dump_file.txt', mode='w')[source]
Function to easily output the result of
str(obj)to a file- Parameters:
obj (any) – python object to sent to a file. Any object can be used, as long as
str(obj)is implemented (see__str__()metaclass definition of your object)file (string) – file path. Default:
./dump_file.txtmode (string) – writing mode of the file Default:
w(write)
- Returns:
nothing
- Return type:
Note
This function was created to help debugging the code while it is running under inkscape. Since inkscape does not possess a terminal as today (2016), this function overcomes partially the issue of sending things to stdout by dumping result of the function
str(obj)in a text file.Example
>>> vector1=[1,2,3,4,5,6]
>>> self.Dump(vector1,file='~/temporary.txt',mode='w')   # writes the list to a file
>>> vector2=[7,8,9,10]
>>> self.Dump(vector2,file='~/temporary.txt',mode='a')   # append the list to a file
- removeElement(element)[source]
Remove one element (can be a group) of the document.
If the parent of the removed element is a group and has no other children, then the parent group is also removed.
- Parameters:
element (inkscape element object) – inkscape element object to be removed. If the element is a group, then all its chidren are also removed.
- Returns:
nothing
- Return type:
Example
>>> rootLayer = self.document.getroot()                              # retrieves the root layer of the file
>>> groupA = self.createGroup(rootLayer,label='temp')                # creates a group inside rootLayer
>>> line1 = inkDraw.line.relCoords(groupA, [[5,0]],[0,0])       # creates a line in groupA
>>> line2 = inkDraw.line.relCoords(rootLayer, [[5,0]],[0,0])    # creates a line in rootLayer
>>> line3 = inkDraw.line.relCoords(groupA, [[15,0]],[10,0])     # creates a line in groupA
>>> self.removeElement(line1)                                         # removes line 1
>>> self.removeElement(line2)                                         # removes line 2
>>> self.removeElement(line3)                                         # removes line 3. Also removes groupA since this group has no other children
>>> groupB = self.createGroup(rootLayer,label='temp1')                # creates a group inside rootLayer
>>> line4 = inkDraw.line.relCoords(groupB, [[5,0]],[0,0])       # creates a line in groupB
>>> self.removeElement(groupB)                                        # removes group B and all its children
- importSVG(parent, fileIn, createGroup=True, position=None, scaleFactor=1.0, unifyDefs=True)[source]
Import SVG file into the current document
- Parameters:
parent (inkscape element object) – parent element where all contents will be placed
fileIn (string) – SVG file path
createGroup (bool) – create a group containing all imported elements. (Default: True)
position – set center position of the group. Used only if createGroup=True (Default: None)
scaleFactor – set scaling factor of the group. Used only if createGroup=True (Default: 1.0)
unifyDefs (bool) – unify the defs node via
unifyDefs(). (Default: False)
- Returns:
imported element objects. If createGroup==True, returns the group. Otherwise returns a list with all imported elements
- Return type:
inkscape element object or list of objects
Example
>>> rootLayer = self.document.getroot()                              # retrieves the root layer of the file
>>> imported1 = self.importSVG(rootLayer,'/path/to/file1.svg',True)  # import contents of the file and group them. imported1 is the group element
>>> imported2 = self.importSVG(rootLayer,'/path/to/file2.svg',False) # import contents of the file. imported2 is a list of the imported elements
- exportSVG(element, fileOut)[source]
Export the element (or list of elements) in a new svgfile.
This function will export the element (or list of elements) to a new SVG file. If a list of elements is passed as argument, all elements in the list will be exported to the same file.
- Parameters:
element (inkscape element object or list of inkscape element objects) – element or list of elements to be exported
fileOut – file path, including the extension.
- Returns:
nothing
- Return type:
Note
Currently (2020), all the defs of the original file will be copied to the new file. Therefore you might want to run the vacuum tool to cleanup the new SVG file
File > Clean um documentExample
>>> rootLayer = self.document.getroot()                          # retrieves the root layer of the file
>>> groupA = self.createGroup(rootLayer,label='temp')            # creates a group inside rootLayer
>>> groupB = self.createGroup(rootLayer,label='child')           # creates a group inside groupA
>>> line1 = inkDraw.line.relCoords(groupA, [[10,0]],[0,0])       # creates a line in groupA
>>> line2 = inkDraw.line.relCoords(groupB, [[20,0]],[0,0])       # creates a line in groupB
>>> self.exportSVG(line1,'path/to/file1.svg')                    # exports only line1
>>> self.exportSVG(groupA,'path/to/file2.svg')                   # exports groupA (and all elements it contais)
>>> self.exportSVG([groupA,groupB],'path/to/file3.svg')          # exports groupA and groupB (and all elements they contain) to the same file
- uniqueIdNumber(prefix_id)[source]
Generate an unique element ID number with a given prefix ID by adding a numeric suffix
This function is used to generate a valid unique ID by concatenating a given prefix with a numeric suffix. The overall format is
prefix-%05d.This function makes sure the ID is unique by checking in
doc_idsmember. This function is specially useful for creating an unique ID for markers and other elements in defs.- Parameters:
prefix_id (string) – prefix of the ID
- Returns:
the unique ID
- Return type:
string
Note
This function has been adapted from inkex.py. However it uses an incremental number method
Example
>>> a=self.uniqueIdNumber('myName')    # a=myName-00001
>>> b=self.uniqueIdNumber('myName')    # b=myName-00002, because myName-00001 is already in use
>>> c=self.uniqueIdNumber('myName')    # c=myName-00003, because myName-00001 and myName-00002 are already in use
>>> d=self.uniqueIdNumber('myNameX')   # d=myNameX-00001
- getDefinitions()[source]
Return the <defs> element of the svg file.
This function returns the principal <defs> element of the current svg file.
if no <defs> can be found, a new empty <defs> is created
- Returns:
the defs element
- Return type:
inkscape element object
- unifyDefs(ungroupChild=False)[source]
Unify all <defs> nodes in a single <defs> node.
- Parameters:
ungroupChild (bool) – if any entry is a group, removes the group. (Default: False)
- Returns:
None
- Return type:
Warning
This function does not check whether the ids are unique!
- getDefsByTag(tag='marker')[source]
Return a list of elements in <defs> of a given a tag.
- Parameters:
tag (string) – tag of the element
- Returns:
a list with the def elements
- Return type:
list of inkscape elements
- getDefsById(id)[source]
Return a list of elements in <defs> of a given (part of) id
- Parameters:
id – (part of the id of the element)
- Returns:
a list with the def elements
- Return type:
list of inkscape elements
- getElemFromXpath(xpath)[source]
Return the element from the xml, given its xpath
- Parameters:
xpath (string) – xpath of the element to be searched
- Returns:
inkscape element object
- Return type:
inkscape element object
Example
>>> name = self.getElemFromXpath('/svg:svg//svg:defs') # returns the list of definitions of the document
- getElemAttrib(elem, attribName)[source]
Return the atribute of one element, given the atribute name
- Parameters:
elem (inkscape element object) – element under consideration
attribName (string) – attribute to be searched. Format: namespace:attrName
- Returns:
attribute
- Return type:
string
Example
>>> elem= self.getElemFromXpath('/svg:svg')               # first get the element. In this example, the entire document
>>> docNAme = self.getElemAttrib(elem,'sodipodi:docname') # now get the name of the document, an attribute of svg:svg
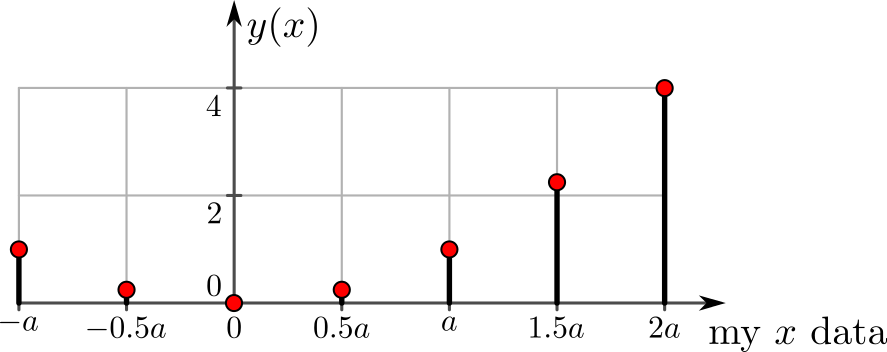
- getDocumentScaleFactor()[source]
Return the scale factor of the document.
The scale factor is defined as
Example
>>> scale = self.getDocumentScaleFactor()
- getDocumentName()[source]
Return the name of the document
- Returns:
fileName
- Return type:
string
Example
>>> name = self.getDocumentName()
- getDocumentUnit()[source]
Return the unit of the document
- Returns:
unit string code. See table below
- Return type:
string
Units
The list of available units are:
Name
string code
relation
millimetre
mm
1in = 25.4mm
centimetre
cm
1cm = 10mm
metre
m
1m = 100cm
kilometre
km
1km = 1000m
inch
in
1in = 96px
foot
ft
1ft = 12in
yard
yd
1yd = 3ft
point
pt
1in = 72pt
pixel
px
pica
pc
1in = 6pc
Example
>>> docunit = self.getDocumentUnit() #returns 'cm', 'mm', etc.
- getcurrentLayer()[source]
Return the current layer of the document
- Returns:
Name of the current layer
- Return type:
string
Example
>>> name = self.getcurrentLayer()
- unit2userUnit(value, unit_in)[source]
Convert a value from given unit to inkscape’s default unit (px)
- Parameters:
value (float) – value to be converted
unit_in (string) – input unit string code. See table below
- Returns:
converted value
- Return type:
float
Units
The list of available units are:
Name
string code
relation
millimetre
mm
1in = 25.4mm
centimetre
cm
1cm = 10mm
metre
m
1m = 100cm
kilometre
km
1km = 1000m
inch
in
1in = 96px
foot
ft
1ft = 12in
yard
yd
1yd = 3ft
point
pt
1in = 72pt
pixel
px
pica
pc
1in = 6pc
Example
>>> x_cm = 5.0
>>> x_px = self.unit2userUnit(x_cm,'cm')       # converts  5.0cm -> 188.97px
- userUnit2unit(value, unit_out)[source]
Convert a value from inkscape’s default unit (px) to specified unit
- Parameters:
value (float) – value to be converted
unit_out (string) – output unit string code. See table below
- Returns:
converted value
- Return type:
float
Units
The list of available units are:
Name
string code
relation
millimetre
mm
1in = 25.4mm
centimetre
cm
1cm = 10mm
metre
m
1m = 100cm
kilometre
km
1km = 1000m
inch
in
1in = 96px
foot
ft
1ft = 12in
yard
yd
1yd = 3ft
point
pt
1in = 72pt
pixel
px
pica
pc
1in = 6pc
Example
>>> x_px = 5.0
>>> x_cm = self.userUnit2unit(x_px,'cm')       # converts  5.0px -> 0.1322cm
- unit2unit(value, unit_in, unit_out)[source]
Convert a value from one unit to another unit
- Parameters:
value (float) – value to be converted
unit_in (string) – input unit string code. See table below
unit_out (string) – output unit string code. See table below
- Returns:
converted value
- Return type:
float
Units
The list of available units are:
Name
string code
relation
millimetre
mm
1in = 25.4mm
centimetre
cm
1cm = 10mm
metre
m
1m = 100cm
kilometre
km
1km = 1000m
inch
in
1in = 96px
foot
ft
1ft = 12in
yard
yd
1yd = 3ft
point
pt
1in = 72pt
pixel
px
pica
pc
1in = 6pc
Example
>>> x_in = 5.0
>>> x_cm = self.unit2unit(x_in,'in','cm')       # converts  5.0in -> 12.7cm
- createGroup(parent, label=None)[source]
Create a new empty group of elements.
This function creates a new empty group of elements. To create new elements inside this groups you must create them informing the group as the parent element.
- Parameters:
parent (inkscape element object) – parent object of the group. It can be another group or the root element
label (string) – label of the group. Default:
None. The label does not have to be unique
- Returns:
the group object
- Return type:
group element
Example
>>> rootLayer = self.document.getroot()                              # retrieves the root layer of the file
>>> groupA = self.createGroup(rootLayer,label='temp')                # creates a group inside rootLayer
>>> groupB = self.createGroup(groupA,label='child')                  # creates a group inside groupA
>>> line1 = inkDraw.line.relCoords(groupA, [[10,0]],[0,0])       # creates a line in groupA
>>> line2 = inkDraw.line.relCoords(groupB, [[20,0]],[0,0])       # creates a line in groupB
- ungroup(group)[source]
Ungroup elements
The new parent element of the ungrouped elements will be the parent of the removed group. See example below
- Parameters:
group (group element) – group to be removed
- Returns:
list of the elements previously contained in the group
- Return type:
list of inkscape object elements
Example
>>> rootLayer = self.document.getroot()                          # retrieves the root layer of the file
>>> groupA = self.createGroup(rootLayer,label='temp')            # creates a group inside rootLayer
>>> groupB = self.createGroup(groupA,label='temp')               # creates a group inside groupA
>>> line1 = inkDraw.line.relCoords(groupA, [[10,0]],[0,0])       # creates a line in groupA
>>> line2 = inkDraw.line.relCoords(groupB, [[20,0]],[0,0])       # creates a line in groupB
>>> line3 = inkDraw.line.relCoords(groupB, [[30,0]],[0,0])       # creates a line in groupB
>>>  # at this point, the file struct is:   rootLayer[groupA[ line1, groupB[ line2, line3 ] ]]
>>> elemList = self.ungroup(groupB)                              # ungroup line2 and line3. elemList is a list containing line2 and line3 elements.
>>>  # now the file struct is:   rootLayer[groupA[ line1, line2, line3 ]]
- getTransformMatrix(element)[source]
Return the transformation attribute of the given element and the resulting 3x3 transformation matrix (numpy Array)
This function is used to extract the transformation operator of a given element.
- Parameters:
element (inkscape element object) – element object with the transformation matrix
- Returns:
list [transfAttrib, transfMatrix]
transfAttrib: string containing all transformations as it is in the file
transfMatrix: numpy array with the resulting 3x3 transformation matrix
- Return type:
tuple
Note
If the element does not have any transformation attribute, this function returns: - transfAttrib=’’ (empty string) - transfMatrix= 3x3 identity matrix
- rotateElement(element, center, angleDeg)[source]
apply a rotation to the element using the transformation matrix attribute.
It is possible to rotate isolated elements or groups.
- Parameters:
element (inkscape element object) – element object to be rotated
center (list) – center point of rotation
angleDeg (float) – angle of rotation in degrees, counter-clockwise direction
- Returns:
nothing
- Return type:
Example
>>> rootLayer = self.document.getroot()                              # retrieves the root layer of the file
>>> groupA = self.createGroup(rootLayer,label='temp')                # creates a group inside rootLayer
>>> line1 = inkDraw.line.relCoords(groupA, [[5,0]],[0,0])       # creates a line in groupA
>>> line2 = inkDraw.line.relCoords(rootLayer, [[5,0]],[0,0])    # creates a line in rootLayer
>>> self.rotateElement(line2,[0,0],120)                              # rotates line2 120 degrees around center x=0,y=0
>>> self.rotateElement(groupA,[1,1],-90)                             # rotates groupA -90 degrees around center x=1,y=1
- copyElement(element, newParent, distance=None, angleDeg=None)[source]
Copy one element to the same parent or other parent group.
It is possible to copy elements isolated or entire groups.
- Parameters:
element (inkscape element object) – element object to be copied
newParent (inkscape element object) – New parent object. Can be another group or the same group
distance (list) – moving distance of the new copy. The coordinates are relative to the original position. If
None, then the copy is placed at the same positionangleDeg (float) – angle of rotation in degrees, counter-clockwise direction
- Returns:
new element
- Return type:
inkscape element object
Example
>>> rootLayer = self.document.getroot()                              # retrieves the root layer of the file
>>> groupA = self.createGroup(rootLayer,label='temp')                # creates a group inside rootLayer
>>> line1 = inkDraw.line.relCoords(groupA, [[5,0]],[0,0])            # creates a line in groupA
>>> line2 = inkDraw.line.relCoords(rootLayer, [[5,0]],[0,0])         # creates a line in rootLayer
>>> self.copyElement(line2,groupA)                                   # create a copy of line2 in groupA
>>> self.moveElement(groupA,[10,-10])                                # moves line2  DeltaX=10, DdeltaY=-10
- moveElement(element, distance)[source]
Move the element using the transformation attribute.
It is possible to move elements isolated or entire groups.
- Parameters:
element (inkscape element object) – element object to be moved
distance (tuple) – moving distance. The coordinates are relative to the original position.
- Returns:
nothing
- Return type:
Example
>>> rootLayer = self.document.getroot()                              # retrieves the root layer of the file
>>> groupA = self.createGroup(rootLayer,label='temp')                # creates a group inside rootLayer
>>> line1 = inkDraw.line.relCoords(groupA, [[5,0]],[0,0])       # creates a line in groupA
>>> line2 = inkDraw.line.relCoords(rootLayer, [[5,0]],[0,0])    # creates a line in rootLayer
>>> self.moveElement(line2,[10,10])                                  # moves line2  DeltaX=10, DdeltaY=10
>>> self.moveElement(groupA,[10,-10])                                # moves line2  DeltaX=10, DdeltaY=-10
- scaleElement(element, scaleX=1.0, scaleY=None, center=None)[source]
Scale the element using the transformation attribute.
It is possible to scale elements isolated or entire groups.
- Parameters:
element (inkscape element object) – element object to be scaled
scaleX (float) – scaling factor in X direction. Default=1.0
scaleY – scaling factor in Y direction. Default=``None``. If scaleY=``None``, then scaleY=scaleX is assumed (default behavior)
center (list) – center point considered as the origin for the scaling. Default=``None``. If
None, the origin is adopted
- Returns:
nothing
- Return type:
Example
>>> rootLayer = self.document.getroot()                              # retrieves the root layer of the file
>>> groupA = self.createGroup(rootLayer,label='temp')                # creates a group inside rootLayer
>>> circ1 = centerRadius(groupA,centerPoint=[0,0],radius=1.0)        # creates a line in groupA
>>> circ2 = centerRadius(rootLayer,centerPoint=[0,0],radius=1.0)     # creates a line in rootLayer
>>> self.scaleElement(circ1,2.0)                                     # scales x2 in both X and Y directions
>>> self.scaleElement(circ1,2.0,3.0)                                 # scales x2 in X and x3 in Y
>>> self.scaleElement(groupA,0.5)                                    # scales x0.5 the group in both X and Y directions
- addAttribute(element, attributeName, attributeValue, forceWrite=False)[source]
Add a new attribute to the element. If the attribute already exists, forceWrite=True overwrites it. Otherwise the attribute is left unchanged.
- Parameters:
element (inkscape element object) – element object
attributeName (string) – attribute name
attributeValue (string) – attribute value
forceWrite (bool) – force write if the attibute already exists
- Returns:
nothing
- Return type:
Example >>> rootLayer = self.document.getroot() # retrieves the root layer of the file >>> line1 = inkDraw.line.relCoords(rootLayer, [[5,0],[0,6]],[0,0]) # creates a line in groupA, using relative coordinates >>> list = self.getPoints(line1) # list = [[0.0, 0.0], [5.0, 0.0], [5.0, 6.0]]
>>> self.addAttribute(line1, attributeName='myInfo', attributeValue='my Data = %f' %3.5, forceWrite=True) # add new attribute
>>> self.addAttribute(line1, attributeName='myInfo', attributeValue='my Data = %f' %4.5, forceWrite=False) # does nothing. attribute already exists
>>> self.addAttribute(line1, attributeName='myInfo', attributeValue='my Data = %f' %5.5, forceWrite=True) # overwrite attribute
- findMarker(markerName)[source]
Search for markerName definition in the document.
- Parameters:
markerName (string) – name of the marker
- Returns:
True if markerName is in the document. False otherwise
- Return type:
bool
- getPoints(element)[source]
Returns a list of points of the element.
This function works on paths, texts, groups, uses, rects. In the case of a group, the function will include recursively all its components.
- Parameters:
element (inkscape element object) – element object
- Returns:
array of points
- Return type:
numpy array
Note
This function will apply any transformation stored in transform attribute, that is, it will compute the resulting coordinates of each object
Example
>>> rootLayer = self.document.getroot()                                   # retrieves the root layer of the file
>>> line1 = inkDraw.line.relCoords(rootLayer, [[5,0],[0,6]],[0,0])        # creates a line in groupA, using relative coordinates
>>> list = self.getPoints(line1)                                          # list = [[0.0, 0.0], [5.0, 0.0], [5.0, 6.0]]
- getBoundingBox(element)[source]
Return the bounding Box of the element.
This function works on paths, texts or groups. In the case of a group, the function will consider recursively all its components
- Parameters:
element (inkscape element object) – element object
- Returns:
two lists: [xMin,yMin] and [xMax,yMax]
- Return type:
list
Note
This function will appply any transformation stored in transform attribute, that is, it will compute the resulting coordinates of each object
Example
>>> rootLayer = self.document.getroot()                                   # retrieves the root layer of the file
>>> line1 = inkDraw.line.relCoords(rootLayer, [[5,0],[0,6]],[0,0])        # creates a line in groupA
>>> BboxMin,BboxMax = self.getBoundingBox(line1)                          # gets BboxMin = [0.0, 0.0] and BboxMax = [5.0, 6.0]
- getCenter(element)[source]
Return the center coordinates of the bounding Box of the element.
This function works on paths, texts or groups. In the case of a group, the function will consider recursively all its components
- Parameters:
element (inkscape element object) – element object
- Returns:
list: [xCenter, yCenter]
- Return type:
list
Note
This function will apply any transformation stored in transform attribute, that is, it will compute the resulting coordinates of each object
Example
>>> rootLayer = self.document.getroot()                                   # retrieves the root layer of the file
>>> line1 = inkDraw.line.relCoords(rootLayer, [[5,0],[0,6]],[0,0])   # creates a line in groupA
>>> Center = self.getCenter(line1)                                        # gets Center = [2.5, 3.0]
- getSegmentFromPoints(pointList, normalDirection='R')[source]
Given two points of a straight line segment, returns the parameters of that segment:
length, angle (in radians), tangent unitary vector and normal unitary vector
- Parameters:
pointList (list of points) – start and end coordinates [ Pstart, Pend ]
normalDirection (string) –
‘R’: normal vector points to the right of the tangent vector (Default)
’L’: normal vector points to the left of the tangent vector
- Returns:
list: [length, theta, t_versor,n_versor]
- Return type:
list
Example
>>> segmentParam = getSegmentFromPoints([[1,1],[2,2]],'R')                               # returns [1.4142, 0.78540, [0.7071,0.7071], [0.7071,-0.7071] ]
>>> segmentParam = getSegmentFromPoints([[1,1],[2,2]],'L')                               # returns [1.4142, 0.78540, [0.7071,0.7071], [-0.7071,0.7071] ]
- getSegmentParameters(element, normalDirection='R')[source]
Given a path segment composed by only two points, returns the parameters of that segment:
length, angle (in radians), start point, end point, tangent unitary vector and normal unitary vector
This function works with paths only.
If the element is not a path, the function returns an empty list
If the path element has more than two points, the function returns an empty list
- Parameters:
element (inkscape element object) – path element object
normalDirection (string) –
‘R’: normal vector points to the right of the tangent vector (Default)
’L’: normal vector points to the left of the tangent vector
- Returns:
list: [Pstart,Pend,length, theta, t_versor,n_versor]
- Return type:
list
Note
This function will apply any transformation stored in transform attribute, that is, it will compute the resulting coordinates of each object
Example
>>> rootLayer = self.document.getroot()                        # retrieves the root layer of the file
>>> line1 = inkDraw.line.absCoords(rootLayer, [[1,1],[2,2]])   # creates a line in groupA
>>> segementList = getSegmentParameters(line1,'R')             # returns [[1,1], [2,2],1.4142, 0.78540,  [0.7071,0.7071], [0.7071,-0.7071] ]
inkscapeMadeEasy_Draw
This module contains classes and functions to help dealing with drawings.
Important
Unless explicitly mentioned, all the code snippet presented in this section assume you are using inkscapeMadeEasy as presented in the Minimal example section and your are within the scope of your extension class and, therefore, can use self.[SOME_FUNCTION].
Note
in all examples, assume inkscapeMadeEasy modules are imported with the following aliases
1import inkscapeMadeEasy.inkscapeMadeEasy_Base as inkBase
2import inkscapeMadeEasy.inkscapeMadeEasy_Draw as inkDraw
3import inkscapeMadeEasy.inkscapeMadeEasy_Plot as inkPlot
- inkscapeMadeEasy_Draw.displayMsg(msg)[source]
Display a message to the user.
- Parameters:
msg (string) – message
- Returns:
nothing
- Return type:
Note
Identical function has been also defined inside
inkscapeMadeEasy_Base.inkscapeMadeEasy()class
- inkscapeMadeEasy_Draw.Dump(obj, file='./dump_file.txt', mode='w')[source]
Function to easily output the result of
str(obj)to a file- Parameters:
obj (any) – python object to sent to a file. Any object can be used, as long as
str(obj)is implemented (see__str__()metaclass definition of your object)file (string) – file path. Default:
./dump_file.txtmode (string) – writing mode of the file Default:
w(write)
- Returns:
nothing
- Return type:
Note
Identical function has been also defined inside
inkscapeMadeEasy_Base.inkscapeMadeEasy()classThis function was created to help debugging the code while it is running under inkscape. Since inkscape does not possess a terminal as today (2016), this function overcomes partially the issue of sending things to stdout by dumping result of the function
str()in a text file.Example
>>> vector1=[1,2,3,4,5,6]
>>> inkDraw.Dump(vector1,file='~/temporary.txt',mode='w')   # writes the list to a file
>>> vector2=[7,8,9,10]
>>> inkDraw.Dump(vector2,file='~/temporary.txt',mode='a')   # append the list to a file
- inkscapeMadeEasy_Draw.circle3Points(P1, P2, P3)[source]
Find the center and radius of a circle based on 3 points on the circle.
Returns [None,None] either if the points are aligned and no (finite radius) circle can be defined or if two of the points are coincident.
- Parameters:
P1,P2,P3 (list) –
points [x,y]
Warning
Keep in mind that Inkscape’s y axis is upside down!
- Returns:
[center, radius]
- Return type:
[numpy array, float]
- class inkscapeMadeEasy_Draw.color[source]
Bases:
objectThis class manipulates color information, generating a string in inkscape’s expected format
#RRGGBBAANote
This class contains only static methods so that your plugin class don’t have to inherit it.
- static defined(colorName, alpha=1.0)[source]
Return the color string representing a predefined color name
- Parameters:
colorName (string) – prededined color name. See figure below
alpha (float) – alpha channel. Values between 0.0 and 1.0
- Returns:
string representing the color in inkscape’s expected format
#RRGGBBAA- Return type:
string
Available pre defined colors
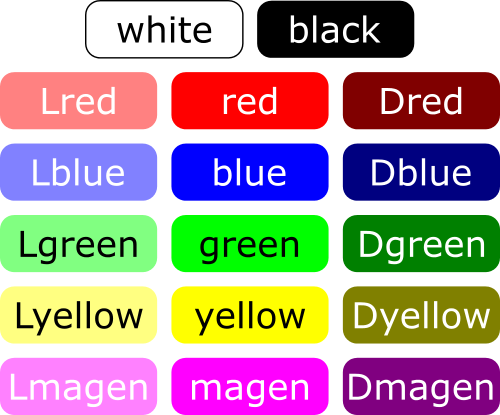
Example
>>> colorString = inkDraw.color.defined('red',1.0) # returns #ff0000ff representing red color
- static RGB(RGBlist, alpha=255)[source]
return a string representing a color specified by RGB level in the range 0-255
- Parameters:
RGBlist (list of ints) – list containing RGB levels in the range 0-225 each
alpha (int) – alpha channel. Values in the range 0-225. Default: 255
- Returns:
string representing the color in inkscape’s expected format
#RRGGBBAA- Return type:
string
Example
>>> colorString = inkDraw.color.RGB([120,80,0],255) # returns a string representing the color R=120, G=80, B=0, A=255
- static rgb(RGBlist, alpha=1.0)[source]
Return a string representing a color specified by RGB level in the range 0.0-1.0
- Parameters:
RGBlist (list of floats) – list containing RGB levels in the range 0.0-1.0 each
alpha (int) – alpha channel. Values in the range 0.0-1.0. Default: 1.0
- Returns:
string representing the color in inkscape’s expected format
#RRGGBBAA- Return type:
string
Example
>>> colorString = color.rgb([0.5,0.8,0.0],255) # returns a string representing the color R=127, G=204, B=0, A=255
- static gray(percentage, alpha=1.0)[source]
Return a string representing a gray color based on white percentage between 0.0 (black) and 1.0 (white)
if percentage is higher than 1.0, percentage is truncated to 1.0 (white)
if percentage is lower than 0.0, percentage is truncated to 0.0 (black)
- Parameters:
percentage (float) – value between 0.0 (black) and 1.0 (white)
alpha (int) – alpha channel. Values in the range 0.0-1.0. Default: 1.0
- Returns:
string representing the color in inkscape’s expected format
#RRGGBBAA- Return type:
string
Example
>>> colorString = color.gray(0.6,1.0) # returns a string representing the gray level with 60% of white, alpha=100%
- static val2hex(value)[source]
return a string representing a color specified by level in the range 0-255
If value is not in the range 0-255, the result will be truncated in this range
- Parameters:
value (int) – color value in the range 0-255
- Returns:
string representing the color in hexadecimal
- Return type:
string
Example
>>> colorString = color.val2hex(255)                   # returns FF
>>> colorString = color.val2hex(127)                   # returns 7F
>>> colorString = color.val2hex(-1)                   # returns 00
>>> colorString = color.val2hex(300)                   # returns FF
- static splitColorAlpha(colorString)[source]
Split color and alpha channel from colorSting in #RRGGBBAA format
- Param:
string representing the color in hexadecimal in #RRGGBBAA format
- Type:
string
- Returns:
a list of strings: [color,alpha] - color: string in
#RRGGBBformat - alpha: string inAAformat- Return type:
list
Example
>>> colorComponents = color.splitColorAlpha('#FFF700FF') # returns ['#FFF700', 'FF']
- static colorPickerToRGBalpha(colorPickerString)[source]
Function that converts the string returned by the widget ‘color’ in the .inx file into 2 strings, one representing the color in format
#RRGGBBand the other representing the alpha channelAAHint
you probably don’t need to use this function. Consider using the method
color.parseColorPicker()- Parameters:
colorPickerString (string) – string returned by ‘color’ widget
- Returns:
a list of strings: [color,alpha] - color: string in
#RRGGBBformat - alpha: string inAAformat- Return type:
list
Note
For more information on this widget, see this.
Usage
1- You must have one parameter of the type ‘color’ in your inx file:
<param name="myColorPicker" type="color"></param>
2- Parse it as a string in your .py file:
self.OptionParser.add_argument("--myColorPicker", type=str, dest="myColorPickerVar", default='#00000000')
- 3- call this function to convert self.options.myColorPickerVar into two strings
#RRGGBB with RGB values in hex
AA with alpha value in hex
Example
Let your .inx file contain a widget of type ‘color’ with the name myColorPicker:
<param name="myColorPicker" type="color"></param>
Then in the .py file
>>> import inkscapeMadeEasy.inkscapeMadeEasy_Base as inkBase
>>> import inkscapeMadeEasy.inkscapeMadeEasy_Draw as inkDraw
>>> import inkscapeMadeEasy.inkscapeMadeEasy_Plot as inkPlot
>>>
>>> class myExtension(inkBase.inkscapeMadeEasy):
>>>   def __init__(self):
>>>     inkBase.inkscapeMadeEasy.__init__(self)
>>>     self.OptionParser.add_argument("--myColorPicker", type=str, dest="myColorPickerVar", default='#000000FF')  # parses the input parameter
>>>
>>>   def effect(self):
>>>     color,alpha = inkDraw.color.colorPickerToRGBalpha(self.options.myColorPickerVar)       # returns the string representing the selected color and alpha channel
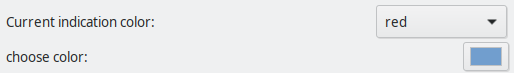
- static parseColorPicker(stringColorOption, stringColorPicker)[source]
Function that converts the string returned by the widgets ‘color’ and ‘optiongroup’ in the .inx file into a string, in format
#RRGGBBAAYou must have in your .inx both ‘optiongroup’ and ‘color’ widgets as defined below. You don’t have to have all the color options presented in the example. The example presents the most complete list with all the default colors in color.defined method.
- Parameters:
stringColorOption (string) – string returned by ‘optiongroup’ widget
stringColorPicker (string) – string returned by ‘color’ widget
- Returns:
color string in
#RRGGBBAAformat- Return type:
string
Note
For more information on this widget, see this link
Example
It works in the following manner: The user select in the optiongroup list the desired color. All pre defined colors in inkscapeMadeEasy are listed there. There is also a ‘my default color’ option where you can set your preferred default color and an ‘use color picker’ option to activate the color picker widget. Keep in mind that the selected color in the color picker widget will be considered ONLY if ‘use color picker’ option is selected.
Example with full form of
colorwidget. In this example ause color pickeris selected from the optiongroup widget. Therefore the color picker widget will have effect
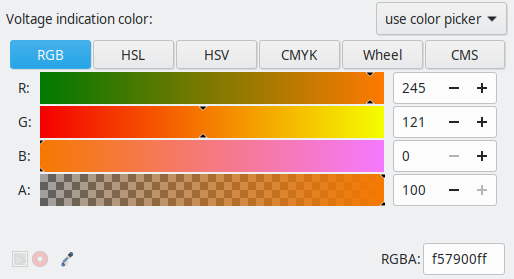
Example with compact form of
colorwidget. In this example a color is selected from the optiongroup widget. Therefore the color picker widget will have no effect
Bellow is the template ‘color’ widget with name ‘myColorPicker’ and an ‘optiongroup’ with the name ‘myColorOption’ for the .inx file:
<param name="myColorOption" type="optiongroup" appearance="minimal" _gui-text="some text here">
    <_option value="#FF0022FF">my default color</_option>    <--you can set your pre define color in the form #RRGGBBAA
    <_option value="none">none</_option>                   <-- no color
    <_option value="black">black</_option>
    <_option value="red">red</_option>
    <_option value="blue">blue</_option>
    <_option value="yellow">yellow</_option>
    <_option value="green">green</_option>          <-- these are all standardized colors in inkscapeMadeEasy_Draw.color class!
    <_option value="magen">magenta</_option>
    <_option value="white">white</_option>
    <_option value="Lred">Lred</_option>
    <_option value="Lblue">Lblue</_option>
    <_option value="Lyellow">Lyellow</_option>
    <_option value="Lgreen">Lgreen</_option>
    <_option value="Lmagen">Lmagenta</_option>
    <_option value="Dred">Dred</_option>
    <_option value="Dblue">Dblue</_option>
    <_option value="Dyellow">Dyellow</_option>
    <_option value="Dgreen">Dgreen</_option>
    <_option value="Dmagen">Dmagenta</_option>
    <_option value="picker">use color picker</_option>     <-- indicate that the color must be taken from the colorPicker attribute
</param>
<param name="myColorPicker" type="color"></param>
Then in the .py file
>>> import inkscapeMadeEasy.inkscapeMadeEasy_Base as inkBase
>>> import inkscapeMadeEasy.inkscapeMadeEasy_Draw as inkDraw
>>> import inkscapeMadeEasy.inkscapeMadeEasy_Plot as inkPlot
>>>
>>> class myExtension(inkBase.inkscapeMadeEasy):
>>>   def __init__(self):
>>>     inkBase.inkscapeMadeEasy.__init__(self)
>>>     self.OptionParser.add_argument("--myColorPicker", type=str, dest="myColorPickerVar", default='0')       # parses the input parameters
>>>     self.OptionParser.add_argument("--myColorOption", type=str, dest="myColorOptionVar", default='black')   # parses the input parameter
>>>
>>>   def effect(self):
>>>     so = self.options
>>>     colorString = inkDraw.color.parseColorPicker(so.myColorOptionVar,so.myColorPickerVar)
- class inkscapeMadeEasy_Draw.marker[source]
Bases:
objectClass to manipulate markers.
This class is used to create new custom markers. Markers can be used with the
inkscapeMadeEasy_Draw.lineStyle()class to define line types that include start, mid and end markersThe base method of this class is
marker.createMarker()that can create custom markers. There are also other methods that simplify the creation of commonly used markers. The implemented predefined markers are presented in the figure below.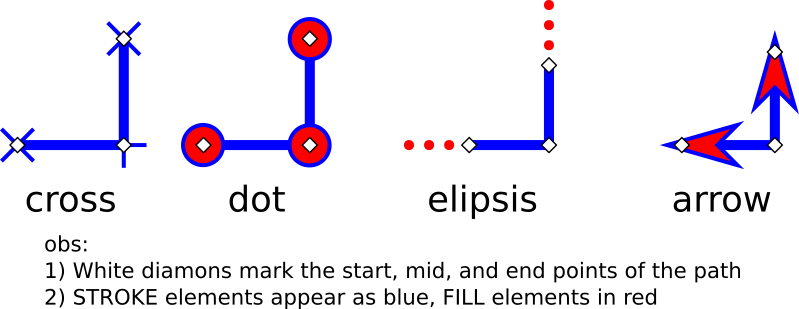
Note
This class contains only static methods so that your plugin class don’t have to inherit it.
- static createMarker(ExtensionBaseObj, nameID, markerPath, RenameMode=0, strokeColor='#000000FF', fillColor='#000000FF', lineWidth=1.0, markerTransform=None)[source]
Create a custom line marker
- Parameters:
ExtensionBaseObj (inkscapeMadeEasy object) – Most of the times you have to pass ‘self’ when calling from inside your plugin class. See example below
nameID (string) – nameID of the marker
markerPath (string) –
Path definition. Must follow ‘d’ attribute format. See this link for further information
RenameMode (int) –
Renaming behavior mode
0: (default) do not rename the marker. If nameID is already taken, the marker will not be modified.
1: overwrite marker definition if nameID is already taken
Warning
when a marker is created using RenameMode=1, any marker with the same name will disapear from inkscape’s canvas. This is an inkscape issue. Save the document and reload it, everything should be fine.
2: Create a new unique nameID, adding a suffix number (Please refer to
inkscapeMadeEasy_Base.inkscapeMadeEasy.uniqueIdNumber()
strokeColor (string) – Stroke color in the format
#RRGGBBAA(hexadecimal), orNonefor no color. Default: color.defined(‘black’). SeeinkscapeMadeEasy_Draw.color()for functions to create color stringsfillColor (string) – Filling color in the format
#RRGGBBAA(hexadecimal), orNonefor no color. Default: color.defined(‘black’). SeeinkscapeMadeEasy_Draw.color()for functions to create color stringslineWidth (float) – Line width of the marker. Default: 1.0
markerTransform (string) –
custom transform applied to marker’s path. Default:
NoneNote
The transform must follow ‘transform’ attribute format. See this link for further information
- Returns:
NameID of the new marker
- Return type:
string
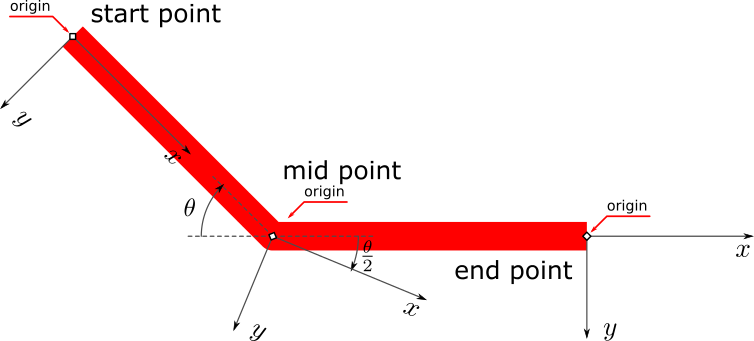
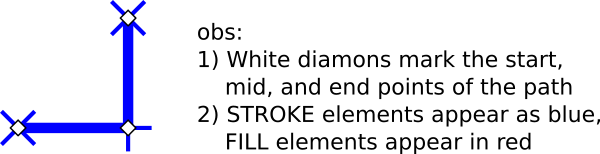
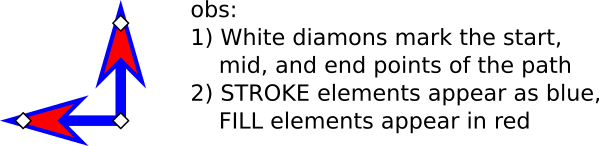
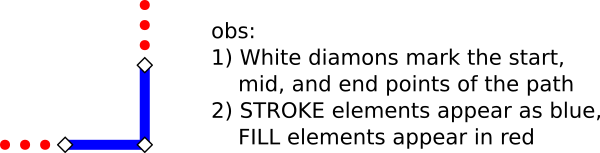
System of coordinates
The system of coordinates of the marker depends on the point under consideration. The following figure presents the coordinate system for all cases
Example
>>> nameID='myMarker'
>>> markerPath='M 3,0 L 0,1 L 0,-1 z'   # defines a path forming an triangle with vertices (3,0) (0,1) (0,-1)
>>> strokeColor=inkDraw.color.defined('red')
>>> fillColor=None
>>> RenameMode=1
>>> width=1
>>> markerTransform=None
>>> markerID=inkDraw.marker.createMarker(self,nameID,markerPath,RenameMode,strokeColor,fillColor,width,markerTransform)
>>> myLineStyle = inkDraw.lineStyle.set(1.0, markerEnd=markerID,lineColor=inkDraw.color.defined('black'))  # see lineStyle class for further information on this function
>>>
>>> #tries to make another marker with the same nameID, changing RenameMode
>>> strokeColor=inkDraw.color.defined('blue')
>>> RenameMode=0
>>> markerID=inkDraw.marker.createMarker(self,nameID,RenameMode,scale,strokeColor,fillColor) # this will not modify the marker
>>> RenameMode=1
>>> markerID=inkDraw.marker.createMarker(self,nameID,RenameMode,scale,strokeColor,fillColor) # modifies the marker 'myMarker'
>>> RenameMode=2
>>> markerID=inkDraw.marker.createMarker(self,nameID,RenameMode,scale,strokeColor,fillColor) # creates a new marker with nameID='myMarker-0001'
Note
In the future, path definition and transformation will be modified to make it easier to design custom markers. =)
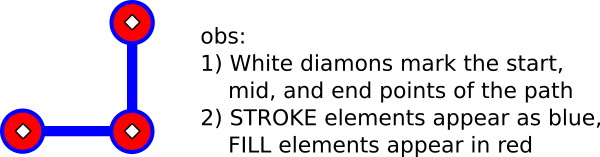
- static createDotMarker(ExtensionBaseObj, nameID, RenameMode=0, scale=0.4, strokeColor='#000000FF', fillColor='#000000FF')[source]
Create circular dot markers, exactly like inkscape default dotS dotM or dotL markers.
- Parameters:
ExtensionBaseObj (inkscapeMadeEasy object) – Most of the times you have to pass ‘self’ when calling from inside your plugin class. See example below
nameID (string) – nameID of the marker
RenameMode (int) –
Renaming behavior mode
0: (default) do not rename the marker. If nameID is already taken, the marker will not be modified.
1: overwrite marker definition if nameID is already taken
Warning
when a marker is created using RenameMode=1, any marker with the same name will disapear from inkscape’s canvas. This is an inkscape issue. Save the document and reload it, everything should be fine.
2: Create a new unique nameID, adding a suffix number (Please refer to
inkscapeMadeEasy_Base.inkscapeMadeEasy.uniqueIdNumber()
scale (float) – Scale factor of the marker. To exactly copy inkscape sizes dotS/M/L, use 0.2, 0.4 and 0.8 respectively. Default: 0.4
strokeColor (string) – Stroke color in the format
#RRGGBBAA(hexadecimal), orNonefor no color. Default: color.defined(‘black’). SeeinkscapeMadeEasy_Draw.color()for functions to create color stringsfillColor (string) – Filling color in the format
#RRGGBBAA(hexadecimal), orNonefor no color. Default: color.defined(‘black’). SeeinkscapeMadeEasy_Draw.color()for functions to create color strings
- Returns:
NameID of the new marker
- Return type:
string
Example
>>> myMarker=inkDraw.marker.createDotMarker(self,nameID='myDotMarkerA',RenameMode=1,scale=0.5,strokeColor=inkDraw.color.defined('red'),fillColor=None)
>>> myLineStyle = inkDraw.lineStyle.set(1.0, markerEnd=myMarker,lineColor=inkDraw.color.defined('black'))  # see lineStyle class for further information on this function
- static createCrossMarker(ExtensionBaseObj, nameID, RenameMode=0, scale=0.4, strokeColor='#000000FF')[source]
Create a cross marker
- Parameters:
ExtensionBaseObj (inkscapeMadeEasy object) – Most of the times you have to pass ‘self’ when calling from inside your plugin class. See example below
nameID (string) – nameID of the marker
RenameMode (int) –
Renaming behavior mode
0: (default) do not rename the marker. If nameID is already taken, the marker will not be modified.
1: overwrite marker definition if nameID is already taken
Warning
when a marker is created using RenameMode=1, any marker with the same name will disapear from inkscape’s canvas. This is an inkscape issue. Save the document and reload it, everything should be fine.
2: Create a new unique nameID, adding a suffix number (Please refer to
inkscapeMadeEasy_Base.inkscapeMadeEasy.uniqueIdNumber()
scale (float) – Scale of the marker. Default: 0.4
strokeColor (string) – Stroke color in the format
#RRGGBBAA(hexadecimal), orNonefor no color. Default: color.defined(‘black’). SeeinkscapeMadeEasy_Draw.color()for functions to create color strings
- Returns:
NameID of the new marker
- Return type:
string
Example
>>> myMarker=inkDraw.marker.createCrossMarker(self,nameID='myDotMarkerA',RenameMode=1,scale=0.5,strokeColor=inkDraw.color.defined('red'))
>>> myLineStyle = inkDraw.lineStyle.set(1.0, markerEnd=myMarker,lineColor=inkDraw.color.defined('black'))  # see lineStyle class for further information on this function
- static createArrow1Marker(ExtensionBaseObj, nameID, RenameMode=0, scale=0.4, strokeColor='#000000FF', fillColor='#000000FF')[source]
Create arrow markers (both start and end markers)
- Parameters:
ExtensionBaseObj (inkscapeMadeEasy object) – Most of the times you have to pass ‘self’ when calling from inside your plugin class. See example below
nameID (string) –
nameID of the marker.
Note
Start and End markers will have ‘Start’ and ‘End’ suffixes respectively
RenameMode (int) –
Renaming behavior mode
0: (default) do not rename the marker. If nameID is already taken, the marker will not be modified.
1: overwrite marker definition if nameID is already taken
Warning
when a marker is created using RenameMode=1, any marker with the same name will disapear from inkscape’s canvas. This is an inkscape issue. Save the document and reload it, everything should be fine.
2: Create a new unique nameID, adding a suffix number (Please refer to
inkscapeMadeEasy_Base.inkscapeMadeEasy.uniqueIdNumber()
scale (float) – scale of the marker. Default: 0.4
strokeColor (string) – Stroke color in the format
#RRGGBBAA(hexadecimal), orNonefor no color. Default: color.defined(‘black’). SeeinkscapeMadeEasy_Draw.color()for functions to create color stringsfillColor (string) – Filling color in the format
#RRGGBBAA(hexadecimal), orNonefor no color. Default: color.defined(‘black’). SeeinkscapeMadeEasy_Draw.color()for functions to create color strings
- Returns:
a list of strings: [startArrowMarker,endArrowMarker] - startArrowMarker: nameID of start marker - endArrowMarker: nameID of end marker
- Return type:
list
Example
>>> StartArrowMarker,EndArrowMarker=inkDraw.marker.createArrow1Marker(self,nameID='myArrow',RenameMode=1,scale=0.5,strokeColor=inkDraw.color.defined('red'),fillColor=None)
>>> myLineStyle = inkDraw.lineStyle.set(1.0, markerStart=StartArrowMarker,markerEnd=EndArrowMarker,lineColor='#000000')  # see lineStyle class for further information on this function
- static createElipsisMarker(ExtensionBaseObj, nameID, RenameMode=0, scale=1.0, fillColor='#000000FF')[source]
Create ellipsis markers, both start and end markers.
Note
These markers differ from inkscape’s default ellipsis since these markers are made such that the diameter of the dots are equal to the line width.
- Parameters:
ExtensionBaseObj (inkscapeMadeEasy object) – Most of the times you have to pass ‘self’ when calling from inside your plugin class. See example below
nameID (string) – nameID of the marker. Start and End markers will have ‘Start’ and ‘End’ suffix respectively
RenameMode (int) –
Renaming behavior mode
0: (default) do not rename the marker. If nameID is already taken, the marker will not be modified.
1: overwrite marker definition if nameID is already taken
Warning
when a marker is created using RenameMode=1, any marker with the same name will disapear from inkscape’s canvas. This is an inkscape issue. Save the document and reload it, everything should be fine.
2: Create a new unique nameID, adding a suffix number (Please refer to
inkscapeMadeEasy_Base.inkscapeMadeEasy.uniqueIdNumber()
scale (float) – Scale of the marker. Default 1.0
fillColor (string) – Filling color in the format
#RRGGBBAA(hexadecimal), orNonefor no color. Default: color.defined(‘black’). SeeinkscapeMadeEasy_Draw.color()for functions to create color strings
- Returns:
a list of strings: [startInfMarker,endInfMarker] - startInfMarker: nameID of start marker - endInfMarker: nameID of end marker
- Return type:
list
Example
>>> startInfMarker,endInfMarker=inkDraw.marker.createElipsisMarker(self,nameID='myInfMarker',RenameMode=1,scale=1.0,fillColor='#00FF00FF')
>>> myLineStyle = inkDraw.lineStyle.set(1.0, markerStart=startInfMarker,markerEnd=endInfMarker,lineColor='#000000FF')  # see lineStyle class for further information on this function
- class inkscapeMadeEasy_Draw.lineStyle[source]
Bases:
objectClass to manipulate line styles.
This class is used to define line styles. It is capable of setting stroke and filling colors, line width, linejoin and linecap, markers (start, mid, and end) and stroke dash array
The base method of this class is
lineStyle.set()that can create custom line types.Note
This class contains only static methods so that your plugin class don’t have to inherit it.
- static set(lineWidth=1.0, lineColor='#000000FF', fillColor=None, lineJoin='round', lineCap='round', markerStart=None, markerMid=None, markerEnd=None, strokeDashArray=None)[source]
Create a new line style
- Parameters:
lineWidth (float) – Line width. Default: 1.0
lineColor (string) – Color in the format
#RRGGBBAA(hexadecimal), orNonefor no color. Default: color.defined(‘black’)fillColor (string) – Color in the format
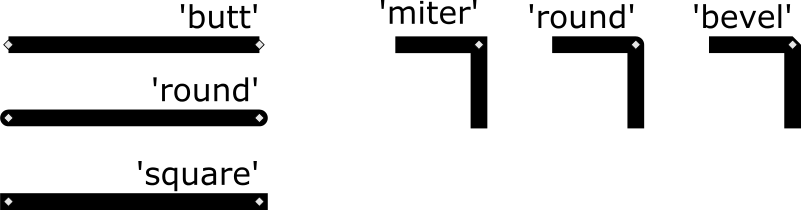
#RRGGBBAA(hexadecimal), orNonefor no color. Default:NonelineJoin (string) – Shape of the lines at the joints. Valid values ‘miter’, ‘round’, ‘bevel’. See image below. Default: round.
lineCap (string) – Shape of the lines at the ends. Valid values ‘butt’, ‘square’, ‘round’. See image below. Default: round
markerStart (string) – Marker at the start node. Default:
NonemarkerMid (string) – Marker at the mid nodes. Default:
NonemarkerEnd (string) – Marker at the end node. Default:
NonestrokeDashArray (string) –
Dashed line pattern definition. Default:
None. See this link for further information. Also, check method createDashedLinePattern
- Returns:
line definition following the provided specifications
- Return type:
string
Line node types
Example
>>> # creates a line style using a dot marker at its end node
>>> myMarker=inkDraw.marker.createDotMarker(self,nameID='myMarker',RenameMode=1,scale=0.5,strokeColor=color.defined('red'),fillColor=None)   # see marker class for further information on this function
>>> myLineStyle = inkDraw.lineStyle.set(lineWidth=1.0, markerEnd=myMarker,lineColor=inkDraw.color.defined('black'),fillColor=inkDraw.color('red'))
>>>
>>> # creates a line style with dashed line (5 units dash , 10 units gap)
>>> dashedPattern = inkDraw.lineStyle.createDashedLinePattern(5,10)
>>> myDashedStyle = inkDraw.lineStyle.set(lineWidth=1.0,lineColor=inkDraw.color.defined('black'),fillColor=inkDraw.color.defined('black'),strokeDashArray=dashedPattern)
>>> # creates a line style with a more complex pattern (5 units dash , 10 units space, 2 units dash, 3 units space
>>> myDashedStyle = inkDraw.lineStyle.set(lineWidth=1.0,lineColor=inkDraw.color.defined('black'),fillColor=inkDraw.color.defined('black'),strokeDashArray='5,10,2,3')
- static createDashedLinePattern(dashLength=5.0, gapLength=10.0)[source]
Creates strokeDashArray of a dashed line necessary for method set
- Parameters:
dashLength (float) – dash length. Default: 5.0
dashLength – gap length. Default: 10.0
- Returns:
strokeDashArray
- Return type:
string
Example
>>> myPattern = inkDraw.lineStyle.createDashedLinePattern(5,12)
>>> myDashedStyle = inkDraw.lineStyle.set(lineWidth=1.0,lineColor=inkDraw.color.defined('black'),fillColor=inkDraw.color.defined('black'),strokeDashArray=myPattern)
- static setSimpleBlack(lineWidth=1.0)[source]
Define a standard black line style.
The only adjustable parameter is its width. The fixed parameters are: lineColor=black, fillColor=None, lineJoin=’round’, lineCap=’round’, no markers, no dash pattern
- Parameters:
lineWidth (float) – line width. Default: 1.0
- Returns:
line definition following the provided specifications
- Return type:
string
Example
>>> mySimpleStyle = inkDraw.lineStyle.setSimpleBlack(lineWidth=2.0)
- class inkscapeMadeEasy_Draw.textStyle[source]
Bases:
objectClass to create text styles.
This class is used to define text styles. It is capable of setting font size, justification, text color, font family, font style, font weight, line spacing, letter spacing and word spacing
Note
This class contains only static methods so that your plugin class don’t have to inherit it.
- static set(fontSize=10, justification='left', textColor='#000000FF', fontFamily='Sans', fontStyle='normal', fontWeight='normal', lineSpacing='100%', letterSpacing='0px', wordSpacing='0px')[source]
Define a new text style
- Parameters:
fontSize (float) – Size of the font in px. Default: 10
justification (string) – Text justification.
left,right,center. Default:lefttextColor (string) – Color in the format
#RRGGBBAA(hexadecimal), orNonefor no color. Default: color.defined(‘black’)fontFamily (string) –
Font family name. Default
SansWarning
This method does NOT verify whether the font family is installed in your machine or not.
fontStyle (string) –
normaloritalic. Default:normalfontWeight (string) –
normalorbold. Default:normallineSpacing (string) – Spacing between lines in percentage. Default:
100%letterSpacing (string) – Extra space between letters. Format:
_px. Default:0pxwordSpacing (string) – Extra space between words. Format:
_px. Default:0px
- Returns:
text style definition following the provided specifications
- Return type:
string
Example
>>> myTextStyle=inkDraw.textStyle.set(fontSize=10, justification='left', textColor=color.defined('black',0.5), fontFamily='Sans',
>>>                                   fontStyle='normal', fontWeight='normal', lineSpacing='100%', letterSpacing='0px', wordSpacing='0px')
- static setSimpleBlack(fontSize=10, justification='left')[source]
Define a standard black text style
The only adjustable parameter are font size and justification. The fixed parameters are: textColor=color.defined(‘black’), fontFamily=’Sans’, fontStyle=’normal’, fontWeight=’normal’, lineSpacing=’100%’, letterSpacing=’0px’, wordSpacing=’0px.
- Parameters:
fontSize (float) – Size of the font in px. Default: 10
justification (string) – Text justification.
left,right,center. Default:left
- Returns:
text style definition following the provided specifications
- Return type:
string
Example
>>> mySimpleStyle = inkDraw.textStyle.setSimpleBlack(fontSize=20,justification='center')
- static setSimpleColor(fontSize=10, justification='left', textColor='#000000FF')[source]
Define a standard colored text style
The only adjustable parameter are font size, justification and textColor. The fixed parameters are: fontFamily=’Sans’, fontStyle=’normal’, fontWeight=’normal’, lineSpacing=’100%’, letterSpacing=’0px’, wordSpacing=’0px.
- Parameters:
fontSize (float) – Size of the font in px. Default: 10
justification (string) – Text justification.
left,right,center. Default:lefttextColor (string) – Color in the format
#RRGGBBAA(hexadecimal), orNonefor no color. Default: color.defined(‘black’)
- Returns:
text style definition following the provided specifications
- Return type:
string
Example
>>> mySimpleStyle = inkDraw.textStyle.setSimpleColor(fontSize=20,justification='center',textColor=inkDraw.color.gray(0.5))
- class inkscapeMadeEasy_Draw.text[source]
Bases:
objectClass for writing texts.
This class allows the cration of regular inkscape’s text elements or LaTeX text. For the later, TexText is incorporated here.
Note
This class contains only static methods so that your plugin class don’t have to inherit it.
Warning
LaTeX support is an optional feature, enabled by default. Please refer to Disabling LaTeX support on how to disable it.
- static write(ExtensionBaseObj, text, coords, parent, textStyle={'fill': '#000000', 'fill-opacity': '1.0', 'font-family': 'Sans', 'font-size': '10px', 'font-style': 'normal', 'font-weight': 'normal', 'letter-spacing': '0px', 'line-height': '100%', 'stroke': 'none', 'text-align': 'start', 'text-anchor': 'start', 'word-spacing': '0px'}, fontSize=None, justification=None, angleDeg=0.0)[source]
Add a text line to the document
- Parameters:
ExtensionBaseObj (inkscapeMadeEasy object) – Most of the times you have to pass ‘self’ when calling from inside your plugin class. See example below
text (string) – Text contents. Use \n in the string to start a new line
coords (list) – Position [x,y]
parent (inkscape element object) – Parent object
textStyle (textStyle object) – Text style to be used. See class
textStyle. Default: textStyle.setSimpleBlack(fontSize=10,justification=’left’)fontSize (float) – Size of the font in px. -
None: Uses fontSize of textStyle argument (Default) - number: takes precedence over the size on textStylejustification (string) – Text justification.
left,right,center-None: Uses justification of textStyle argument (Default) -left,right,center: takes precedence over the justification set on textStyleangleDeg (float) – Angle of the text, counterclockwise, in degrees. Default: 0
- Returns:
the new text object
- Return type:
text Object
Example
>>> root_layer = self.document.getroot()     # retrieves the root layer of the document
>>> mySimpleStyle = inkDraw.textStyle.setSimpleBlack(fontSize=20,justification='center')  # creates a simple text style.
>>>
>>> #adds a two-line text, at the point x=5.0,y=6.0
>>> #               L1: 'foo bar who-hoo!'
>>> #               L2: 'second line!'
>>> myText='foo bar who-hoo!\nsecond line!'
>>> inkDraw.text.write(self, text=myText, coords=[5.0,6.0], parent=root_layer, textStyle=mySimpleStyle, fontSize=None, justification=None, angleDeg=0.0)
>>>
>>> # creates a group in root-layer and add text to it
>>> myGroup = self.createGroup(root_layer,'textGroup')
>>> #adds a text 'foo bar', rotated 45 degrees, at the point x=0,y=0, overriding justification of mySimpleStyle
>>> inkDraw.text.write(self, text='foo bar', coords=[0.0,0.0], parent=myGroup, textStyle=mySimpleStyle, fontSize=None, justification='left', angleDeg=45.0)
- static latex(ExtensionBaseObj, parent, LaTeXtext, position, fontSize=10, refPoint='cc', textColor='#000000FF', LatexCommands=' ', angleDeg=0, preambleFile=None)[source]
Creates text element using LaTeX. You can use any LaTeX contents here.
Note
LaTeX support is an optional feature that requires a few extra packages to be installed outside inkscape. It is enabled by default. Please refer to Disabling LaTeX support on how to disable it. If disabled, this function will still work, internally calling the
text.write().- Parameters:
ExtensionBaseObj (inkscapeMadeEasy object) – Most of the times you have to pass ‘self’ when calling from inside your plugin class. See example below
parent (inkscape element object) – parent object
LaTeXtext (string) – Contents of the text. Can contain any latex command
position (list) – Position of the reference point [x,y]
fontSize (float) – Size of the font. Assume any capitql letter of
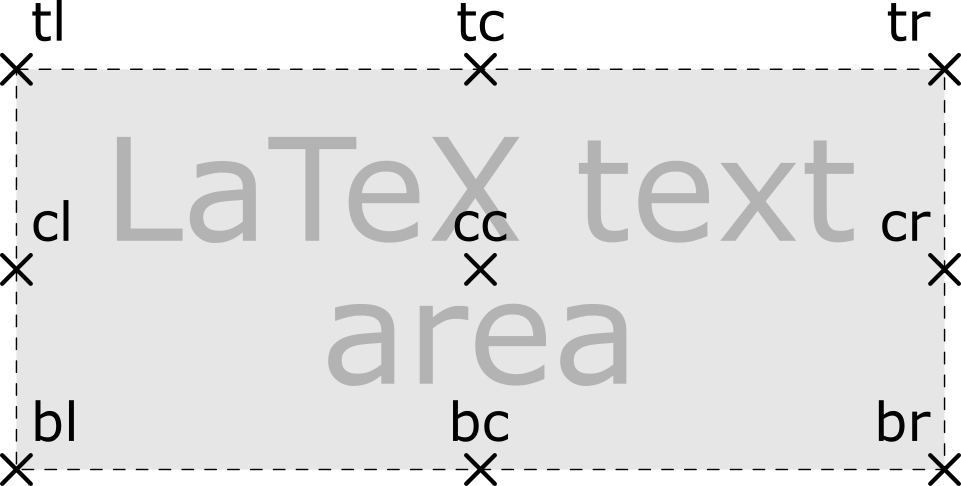
\normalsizewill have this size. Default: 10refPoint (string) – Text reference Point. See figure below for options. Default:
cctextColor (string) – Color in the format
#RRGGBBAA(hexadecimal), orNonefor no color. Default: color.defined(‘black’)LatexCommands (string) – Commands to be included before LaTeXtext (default: ‘ ‘). If LaTeX support is disabled, this parameter has no effect.
angleDeg (float) – Angle of the text, counterclockwise, in degrees. Default: 0
preambleFile (string) – Optional preamble file to be included. Default: None. If LaTeX support is disabled, this parameter has no effect.
- Returns:
the new text object
- Return type:
text Object
Note
This function does not use
textStyleclass elements.Reference point options
Standard Preamble file
When a preamble file is not provided, inkscapeMadeEasy assumes a standard preamble file located at
./textextLib/basicLatexPackages.tex. By default, its contents is:\usepackage{amsmath,amsthm,amsbsy,amsfonts,amssymb} \usepackage[per=slash]{siunitx} \usepackage{steinmetz} \usepackage[utf8]{inputenc}
You will need these packages installed. This file can be modified to include extra default packages and/or commands.
LaTeX .tex document structure
LaTeX .tex document have the following structure. Note that LatexCommands lies within document environment:
\documentclass[landscape,a0]{article}

[contents of Preamble file]

\pagestyle{empty}

\begin{document}
\noindent

[contents of LatexCommands]

[contens of LaTeXtext]

\end{document}
Example
>>> root_layer = self.document.getroot()     # retrieves the root layer of the document
>>> customCommand = r'\newcommand{\fooBar}{\textbf{Foo Bar Function! WhooHoo!}}'   # do not forget the r to avoid backslash escape.
>>> inkDraw.text.latex(self, root_layer,r'This is one equation \begin{align} x=y^2\end{align} And this is my \fooBar{}',
>>>                    position=[0.0,0.0], fontSize=10, refPoint='cc', textColor=inkDraw.color.defined('black'), LatexCommands=customCommand, angleDeg=0, preambleFile=None)
- class inkscapeMadeEasy_Draw.cubicBezier[source]
Bases:
objectThis is a class with different methods for drawing cubic bezier lines.
Note
This class contains only static methods so that your plugin class don’t have to inherit it.
- static addNode(NodeList, coord=[0, 0], cPbefore=[-1, 0], cPafter=[1, 0], typeNode='corner', flagAbsCoords=True)[source]
Add a new node to the list of nodes of the cubic bezier line.
Important
This function does not draw the curve. To draw the curve see
cubicBezier.draw()method.- Parameters:
NodeList (list) – Lst of nodes that will receive (append) the new node.
coord (list [x,y]) – List with the coordinates of the node
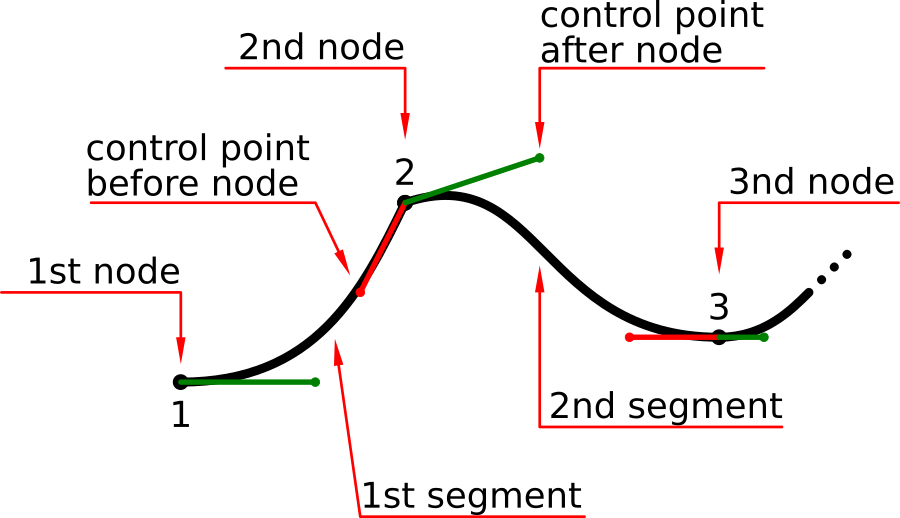
cPbefore (list [x,y]) – List with the coordinates of the control point before the node.
cPafter (list [x,y]) – List with the coordinates of the control point after the node. Used only if ‘typeNode’ is ‘smooth’ or ‘corner’
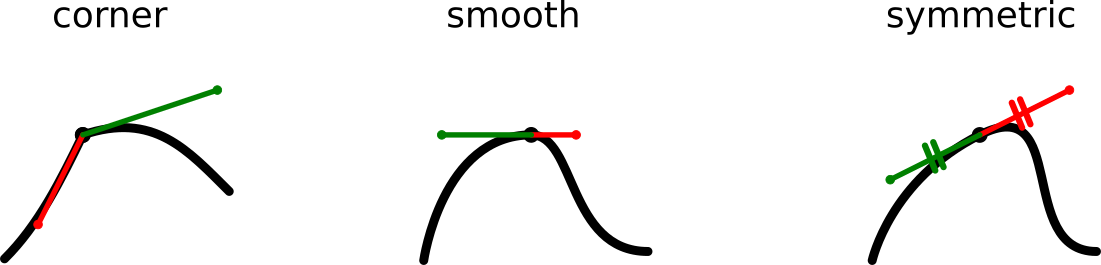
typeNode (string) –
type of node to be added. See image below
corner: Node without smoothness constraint. The bezier curve can have a sharp edge at this nodesmooth: Node with smoothness constraint. The bezier curve will be smooth at this node. If the control points do not form a straight line, then they are modified to form a straight line. See image belowsymmetric: same assmooth, but the control points are forced to be symmetric with respect to the node.
flagAbsCoords (bool) – Indicate absolute or relative coordinates. See section below on how reference system works. .. warning:: All nodes in a given list must be defined in the same reference system (absolute or relative).
- Returns:
None
- Return type:
Node Types
The image below presents the types of nodes
Smoothing control nodes
Image below present the process of smoothing control nodes not completely aligned when
smoothis selected.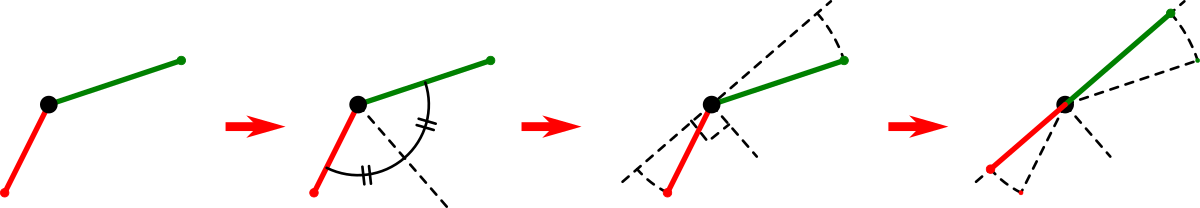
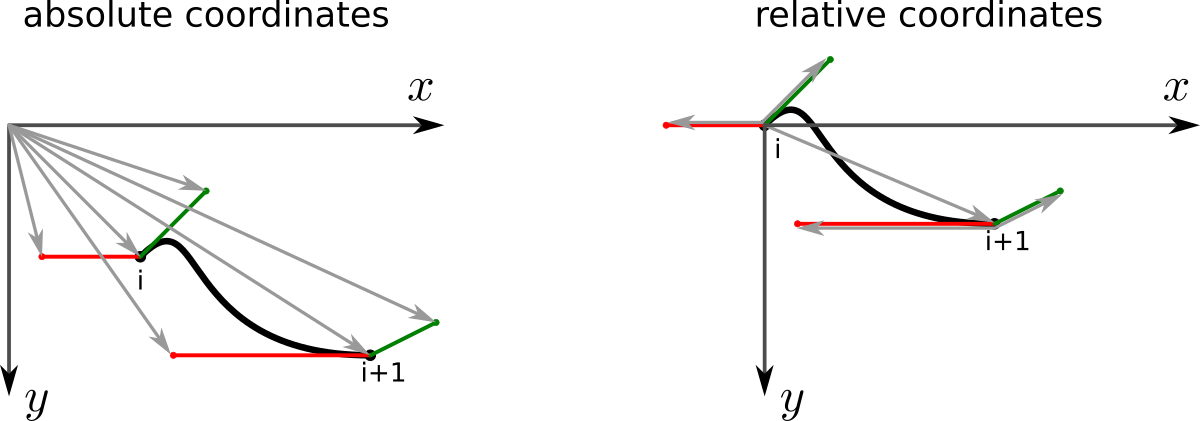
Absolute and relative coordinate systems
Cubic bezier curves are composed by segments which are defined by 4 coordinates, two node coordinates and two control points.
In absolute coordinate system, all node and control point locations are specified using the origin as reference. In relative coordinate system, control point localizations are specified using its node as reference, and each node use the previous node as reference (the first node use the origin as reference). See image below.
Warning
Keep in mind that Inkscape’s y axis is upside down!
Example
Note
In the following example, the control point before the first node and after the last node are important when the bezier curve must be closed. See method
draw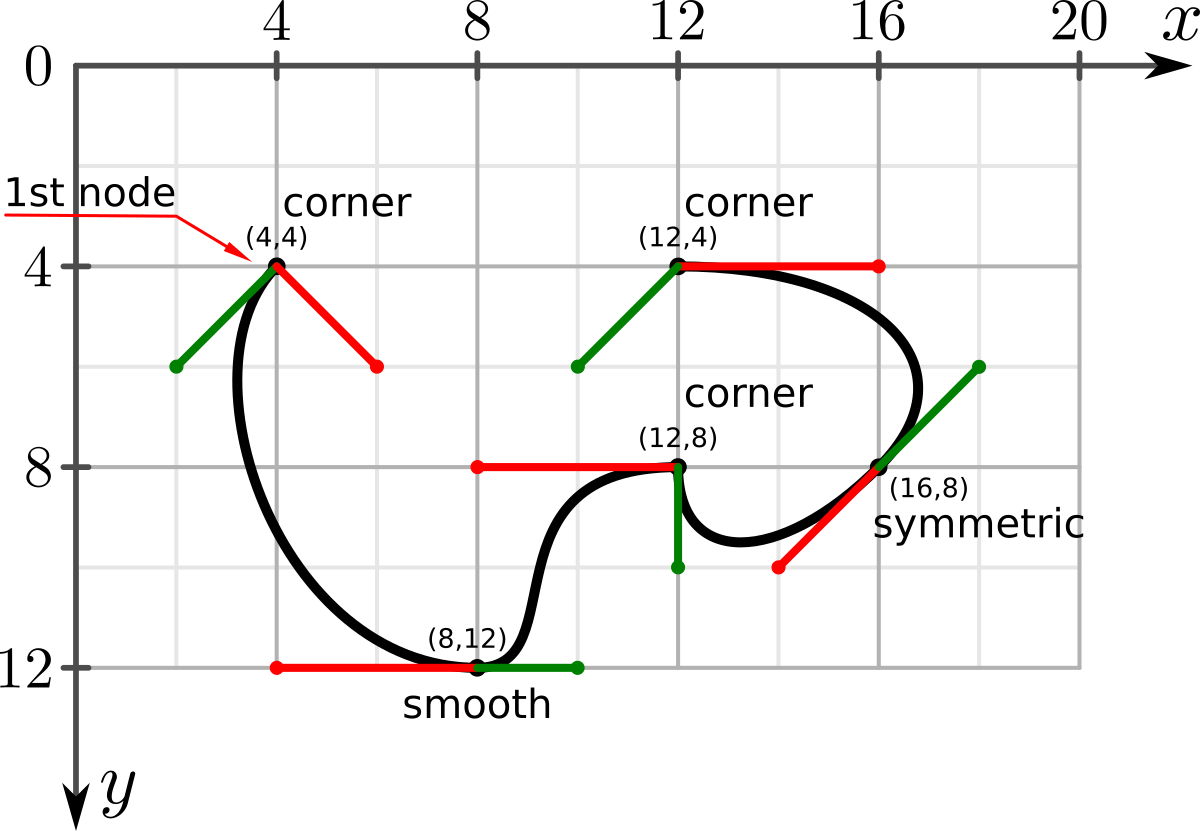
>>> # create a list of nodes using absolute coordinate system
>>> nodeListABS=[]
>>> inkDraw.cubicBezier.addNode(nodeListABS, coord=[4,4], cPbefore=[6,6], cPafter=[2,6], typeNode='corner', flagAbsCoords=True)
>>> inkDraw.cubicBezier.addNode(nodeListABS, coord=[8,12], cPbefore=[4,12], cPafter=[10,12], typeNode='smooth', flagAbsCoords=True)
>>> inkDraw.cubicBezier.addNode(nodeListABS, coord=[12,8], cPbefore=[8,8], cPafter=[12,10], typeNode='corner', flagAbsCoords=True)
>>> inkDraw.cubicBezier.addNode(nodeListABS, coord=[16,8], cPbefore=[14,10], cPafter=None, typeNode='symmetric', flagAbsCoords=True)
>>> inkDraw.cubicBezier.addNode(nodeListABS, coord=[12,4], cPbefore=[16,4], cPafter=[10,6], typeNode='corner', flagAbsCoords=True)
>>> # create a list of nodes using relative coordinate system
>>> nodeListREL=[]
>>> inkDraw.cubicBezier.addNode(nodeListREL, coord=[4, 4], cPbefore=[2,2], cPafter=[-2,2], typeNode='corner', flagAbsCoords=False)
>>> inkDraw.cubicBezier.addNode(nodeListREL, coord=[4, 8], cPbefore=[-4,0], cPafter=[2,0], typeNode='smooth', flagAbsCoords=False)
>>> inkDraw.cubicBezier.addNode(nodeListREL, coord=[4, -4], cPbefore=[-4,0], cPafter=[0,2], typeNode='corner', flagAbsCoords=False)
>>> inkDraw.cubicBezier.addNode(nodeListREL, coord=[4, 0], cPbefore=[-2,2], cPafter=None, typeNode='symmetric', flagAbsCoords=False)
>>> inkDraw.cubicBezier.addNode(nodeListREL, coord=[-4,-4], cPbefore=[4,0], cPafter=[-2,2], typeNode='corner', flagAbsCoords=False)
- static draw(parent, NodeList, offset=array([0, 0]), label='none', lineStyle={'fill': 'none', 'fill-opacity': '1.0', 'stroke': '#000000', 'stroke-dasharray': 'none', 'stroke-linecap': 'round', 'stroke-linejoin': 'round', 'stroke-opacity': '1.0', 'stroke-width': '1.0'}, closePath=False)[source]
draws the bezier line, given a list of nodes, built using
cubicBezier.addNode()method- Parameters:
parent (inkscape element object) – parent object
NodeList (list of nodes) – list of nodes. See :cubicBezier.addNode method
offset (list) – offset coords. Default [0,0]
label (string) – label of the line. Default ‘none’
lineStyle (lineStyle object) – line style to be used. See
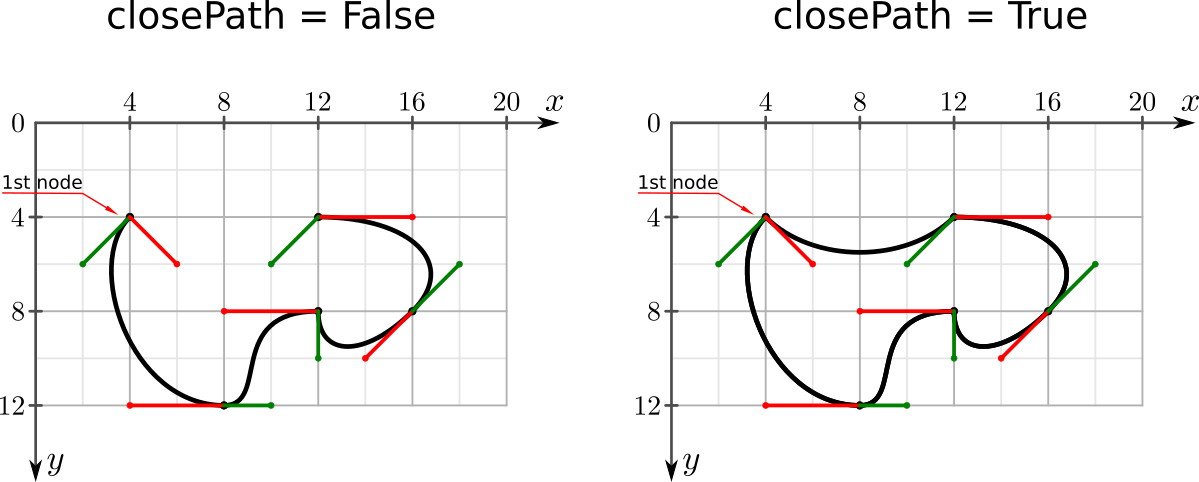
lineStyleclass. Default: lineStyle=lineStyle.setSimpleBlack()closePath (bool) – Connects the first point to the last. Default: False
- Returns:
the new line object
- Return type:
line Object
Example
Note
In the following example, the control point before the first node and after the last node are important when the bezier curve must be closed.
>>> root_layer = self.document.getroot()     # retrieves the root layer of the document
>>> myLineStyle = set(lineWidth=1.0, lineColor=color.defined('red'))
>>> # create a list of nodes using absolute coordinate system
>>> nodeListABS=[]
>>> inkDraw.cubicBezier.addNode(nodeListABS, coord=[4,4], cPbefore=[6,6], cPafter=[2,6], typeNode='corner', flagAbsCoords=True)
>>> inkDraw.cubicBezier.addNode(nodeListABS, coord=[8,12], cPbefore=[4,12], cPafter=[10,12], typeNode='smooth', flagAbsCoords=True)
>>> inkDraw.cubicBezier.addNode(nodeListABS, coord=[12,8], cPbefore=[8,8], cPafter=[12,10], typeNode='corner', flagAbsCoords=True)
>>> inkDraw.cubicBezier.addNode(nodeListABS, coord=[16,8], cPbefore=[14,10], cPafter=None, typeNode='symmetric', flagAbsCoords=True)
>>> inkDraw.cubicBezier.addNode(nodeListABS, coord=[12,4], cPbefore=[16,4], cPafter=[10,6], typeNode='corner', flagAbsCoords=True)
>>> # create a list of nodes using relative coordinate system
>>> nodeListREL=[]
>>> inkDraw.cubicBezier.addNode(nodeListREL, coord=[4, 4], cPbefore=[2,2], cPafter=[-2,2], typeNode='corner', flagAbsCoords=False)
>>> inkDraw.cubicBezier.addNode(nodeListREL, coord=[4, 8], cPbefore=[-4,0], cPafter=[2,0], typeNode='smooth', flagAbsCoords=False)
>>> inkDraw.cubicBezier.addNode(nodeListREL, coord=[4, -4], cPbefore=[-4,0], cPafter=[0,2], typeNode='corner', flagAbsCoords=False)
>>> inkDraw.cubicBezier.addNode(nodeListREL, coord=[4, 0], cPbefore=[-2,2], cPafter=None, typeNode='symmetric', flagAbsCoords=False)
>>> inkDraw.cubicBezier.addNode(nodeListREL, coord=[-4,-4], cPbefore=[4,0], cPafter=[-2,2], typeNode='corner', flagAbsCoords=False)
>>> C1 = inkDraw.cubicBezier.draw(root_layer,nodeListABS, offset=[0, 0],closePath=False)
>>> C2 = inkDraw.cubicBezier.draw(root_layer,nodeListABS, offset=[0, 0],closePath=True)
>>> C3 = inkDraw.cubicBezier.draw(root_layer,nodeListREL, offset=[0, 0],closePath=False)
>>> C4 = inkDraw.cubicBezier.draw(root_layer,nodeListREL, offset=[0, 0],closePath=True)
Result of the example
- class inkscapeMadeEasy_Draw.line[source]
Bases:
objectclass with methods for drawing lines (paths).
Note
This class contains only static methods so that your plugin class don’t have to inherit it.
- static absCoords(parent, coordsList, offset=[0, 0], label='none', lineStyle={'fill': 'none', 'fill-opacity': '1.0', 'stroke': '#000000', 'stroke-dasharray': 'none', 'stroke-linecap': 'round', 'stroke-linejoin': 'round', 'stroke-opacity': '1.0', 'stroke-width': '1.0'}, closePath=False)[source]
Draw a (poly)line based on a list of absolute coordinates
- Parameters:
parent (inkscape element object) – Parent object
coordsList (list of list) –
List with coords x and y. ex: [[x1,y1], …, [xN,yN]]
Warning
Keep in mind that Inkscape’s y axis is upside down!
offset (list) – Offset coords. Default [0,0]
label (string) – Label of the line. Default ‘none’
lineStyle (lineStyle object) – Line style to be used. See
lineStyleclass. Default: lineStyle=lineStyle.setSimpleBlack()closePath (bool) – Connects the first point to the last. Default: False
- Returns:
the new line object
- Return type:
line Object
Example
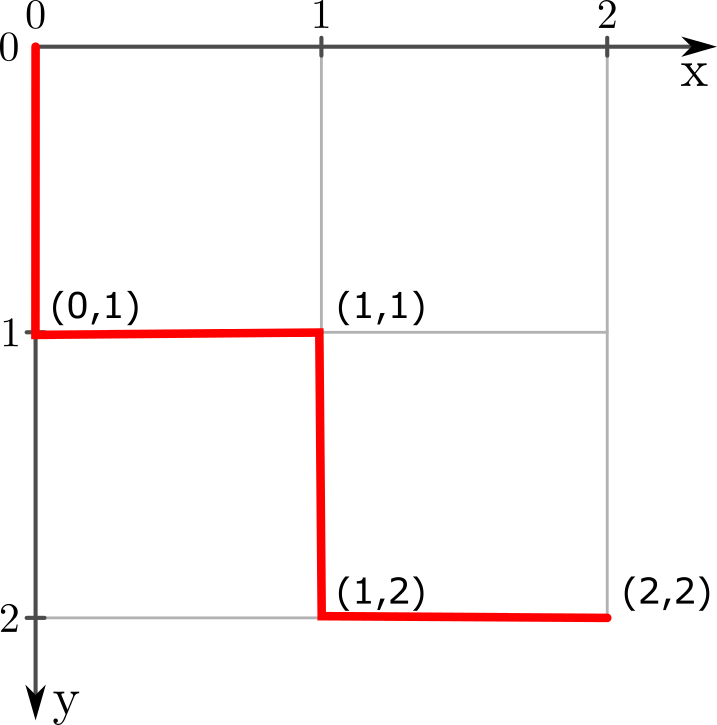
>>> root_layer = self.document.getroot()     # retrieves the root layer of the document
>>> myLineStyle = inkDraw.lineStyle.set(lineWidth=1.0, lineColor=color.defined('red'))
>>>
>>> # creates a polyline passing through points (0,0) (0,1) (1,1) (1,2) (2,2), and using absolute coordinates
>>> coords=[ [0,0], [0,1], [1,1], [1,2], [2,2] ]
>>> inkDraw.line.absCoords(root_layer, coordsList=coords, offset=[0, 0], label='fooBarLine', lineStyle=myLineStyle)
>>>
>>> # creates the same polyline translated to point (5,6). Note we just have to change the offset
>>> inkDraw.line.absCoords(root_layer, coordsList=coords, offset=[5, 6], label='fooBarLine', lineStyle=myLineStyle)
- static relCoords(parent, coordsList, offset=[0, 0], label='none', lineStyle={'fill': 'none', 'fill-opacity': '1.0', 'stroke': '#000000', 'stroke-dasharray': 'none', 'stroke-linecap': 'round', 'stroke-linejoin': 'round', 'stroke-opacity': '1.0', 'stroke-width': '1.0'}, closePath=False)[source]
Draw a (poly)line based on a list of relative coordinates
- Parameters:
parent (inkscape element object) – Parent object
coordsList (list of list) –
List with distances dx and dy for all points. ex [[dx1,dy1], …, [dxN,dyN]]
Warning
Keep in mind that Inkscape’s y axis is upside down!
offset (list) – Offset coords. Default [0,0]
label (string) – Label of the line. Default ‘none’
lineStyle (lineStyle object) – Line style to be used. See
lineStyleclass. Default: lineStyle=lineStyle.setSimpleBlack()closePath (bool) – Connects the first point to the last. Default: False
- Returns:
the new line object
- Return type:
line Object
Example
>>> root_layer = self.document.getroot()     # retrieves the root layer of the document
>>> myLineStyle = inkDraw.lineStyle.setSimpleBlack(lineWidth=1.0)
>>>
>>> # creates a polyline passing through points (0,0) (0,1) (1,1) (1,2) (2,2) using relative coordinates
>>> coords=[ [0,1], [1,0], [0,1], [1,0] ]
>>> inkDraw.line.relCoords(root_layer, coordsList=coords, offset=[0, 0], label='fooBarLine', lineStyle=myLineStyle)
>>>
>>> # creates the same polyline translated to point (5,6)
>>> inkDraw.line.relCoords(root_layer, coordsList=coords, offset=[5, 6], label='fooBarLine', lineStyle=myLineStyle)
- class inkscapeMadeEasy_Draw.arc[source]
Bases:
objectClass with methods for drawing arcs.
Note
This class contains only static methods so that your plugin class don’t have to inherit it.
- static startEndRadius(parent, Pstart, Pend, radius, offset=[0, 0], label='arc', lineStyle={'fill': 'none', 'fill-opacity': '1.0', 'stroke': '#000000', 'stroke-dasharray': 'none', 'stroke-linecap': 'round', 'stroke-linejoin': 'round', 'stroke-opacity': '1.0', 'stroke-width': '1.0'}, flagRightOf=True, arcType='open', largeArc=False)[source]
Draw a circle arc from
PstarttoPendwith a given radius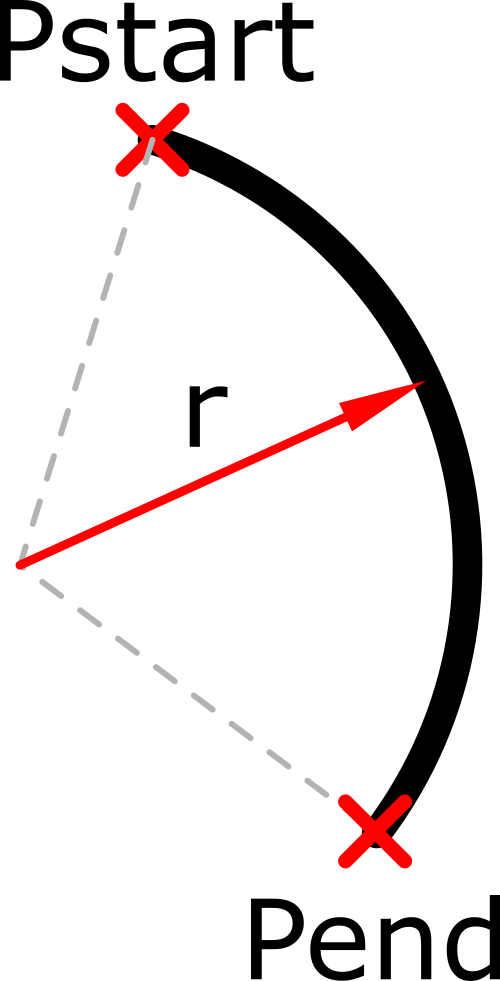
- Parameters:
parent (inkscape element object) – Parent object
Pstart (list) –
Start coordinate [x,y]
Warning
Keep in mind that Inkscape’s y axis is upside down!
Pend (list) – End coordinate [x,y]
radius (float) – Arc radius
offset (list) – Extra offset coords [x,y]. Default [0,0]
label (string) – Label of the line. Default ‘arc’
lineStyle (lineStyle object) – Line style to be used. See
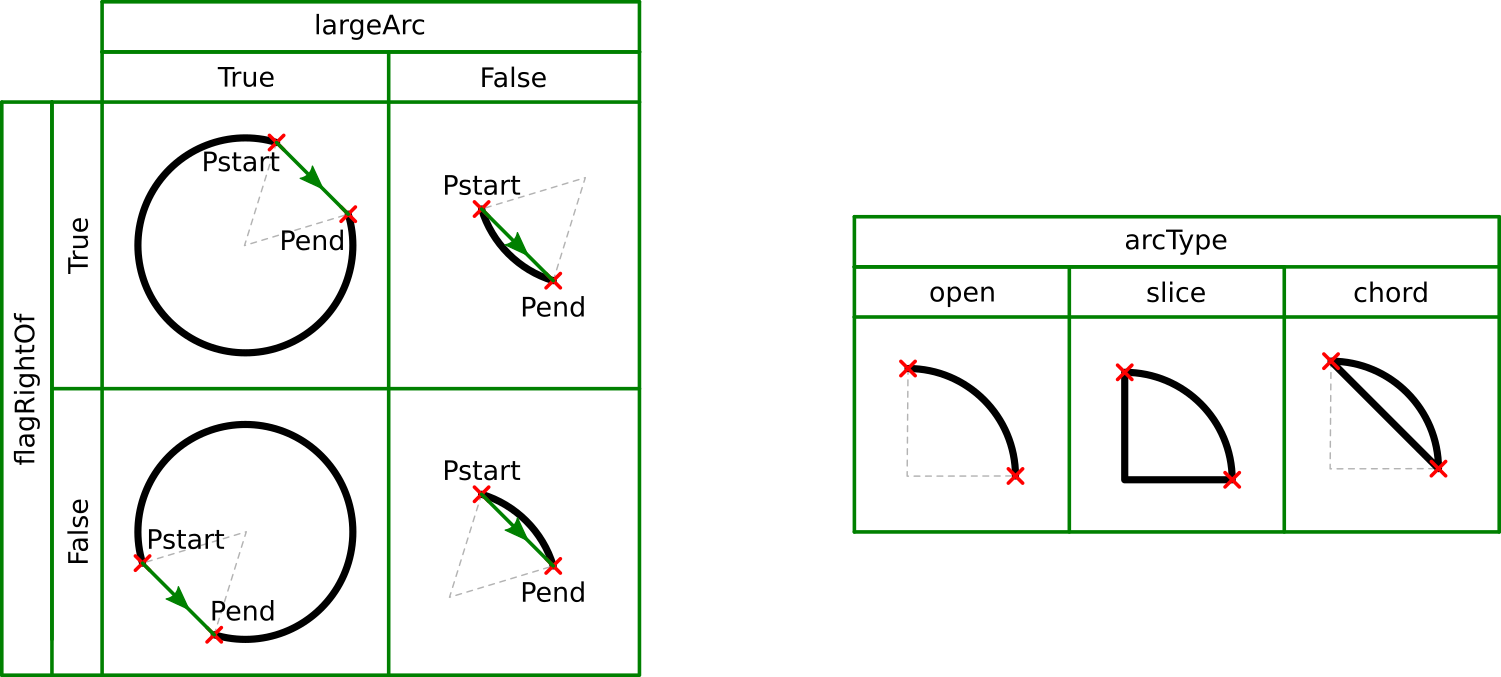
lineStyleclass. Default: lineStyle=lineStyle.setSimpleBlack()flagRightOf (bool) –
Sets the side of the vector Pend-Pstart which the arc must be drawn. See image below
True: Draws the arc to the right (Default)
False: Draws the arc to the left
arcType (string) – type of arc. Valid values: ‘open’, ‘slice’, ‘chord’. See image below. Default: ‘open’
largeArc (bool) –
Sets the largest arc to be drawn. See image below
True: Draws the largest arc
False: Draws the smallest arc (Default)
- Returns:
the new arc object
- Return type:
line Object
Arc options
Example
>>> root_layer = self.document.getroot()     # retrieves the root layer of the document
>>>
>>> P1=[10.0,0.0]
>>> P2=[20.0,10.0]
>>> R=15.0
>>> myLineStyle=inkDraw.lineStyle.setSimpleBlack()
>>>
>>> #draws an open arc
>>> inkDraw.arc.startEndRadius(parent=root_layer, Pstart=P1, Pend=P2, radius=R, offset=[25,0], label='arc1',  lineStyle=myLineStyle, arcType='open')
>>>
>>> #draws a closed (slice) arc
>>> inkDraw.arc.startEndRadius(parent=root_layer, Pstart=P1, Pend=P2, radius=R, offset=[25,20], label='arc2',  lineStyle=myLineStyle, arcType='slice')
>>>
>>> #draws an open arc to the right
>>> inkDraw.arc.startEndRadius(parent=root_layer, Pstart=P1, Pend=P2, radius=R, offset=[0,0], label='arc',  lineStyle=myLineStyle, flagRightOf=True, largeArc=True)
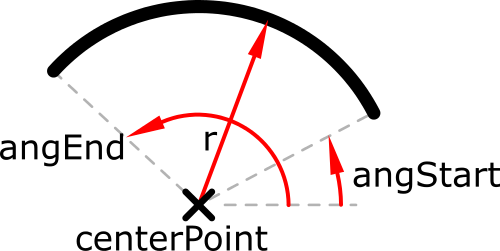
- static centerAngStartAngEnd(parent, centerPoint, radius, angStart, angEnd, offset=[0, 0], label='arc', lineStyle={'fill': 'none', 'fill-opacity': '1.0', 'stroke': '#000000', 'stroke-dasharray': 'none', 'stroke-linecap': 'round', 'stroke-linejoin': 'round', 'stroke-opacity': '1.0', 'stroke-width': '1.0'}, arcType='open', largeArc=False)[source]
Draw a circle arc given its center and start and end angles
- Parameters:
parent (inkscape element object) – parent object
centerPoint (list) –
center coordinate [x,y]
Warning
Keep in mind that Inkscape’s y axis is upside down!
radius (float) – Arc radius
angStart (float) – Start angle in degrees
angEnd (float) – End angle in degrees
offset (list) – Extra offset coords [x,y]
label (string) – Label of the line. Default ‘arc’
lineStyle (lineStyle object) – Line style to be used. See
lineStyleclass. Default: lineStyle=lineStyle.setSimpleBlack()arcType (string) – Type of arc. Valid values: ‘open’, ‘slice’, ‘chord’. See image below. Default: ‘open’
largeArc (bool) –
Sets the largest arc to be drawn. See image below
True: Draws the largest arc
False: Draws the smallest arc (Default)
- Returns:
the new arc object
- Return type:
line Object
Arc options
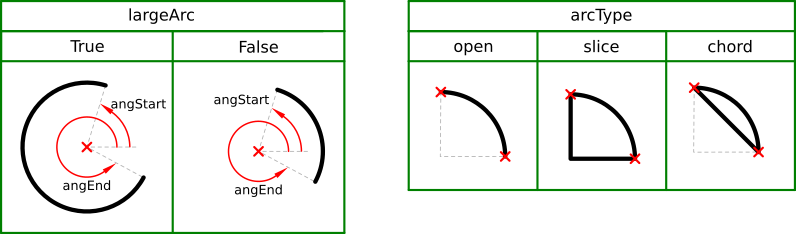
Example
>>> root_layer = self.document.getroot()     # retrieves the root layer of the document
>>> myLineStyle = inkDraw.lineStyle.setSimpleBlack()
>>>
>>> #draws the shortest arc
>>> inkDraw.arc.centerAngStartAngEnd(parent=root_layer, centerPoint=[0,0], radius=15.0, angStart=-10, angEnd=90,
>>>                                  offset=[0,0], label='arc1',  lineStyle=myLineStyle, arcType='open',largeArc=False)
>>> #draws the longest arc
>>> inkDraw.arc.centerAngStartAngEnd(parent=root_layer, centerPoint=[0,0], radius=15.0, angStart=-10, angEnd=90,
>>>                                  offset=[30,0], label='arc1',  lineStyle=myLineStyle, arcType='open',largeArc=True)
- static threePoints(parent, Pstart, Pmid, Pend, offset=[0, 0], label='arc', lineStyle={'fill': 'none', 'fill-opacity': '1.0', 'stroke': '#000000', 'stroke-dasharray': 'none', 'stroke-linecap': 'round', 'stroke-linejoin': 'round', 'stroke-opacity': '1.0', 'stroke-width': '1.0'}, arcType='open')[source]
Draw a circle arc given 3 points
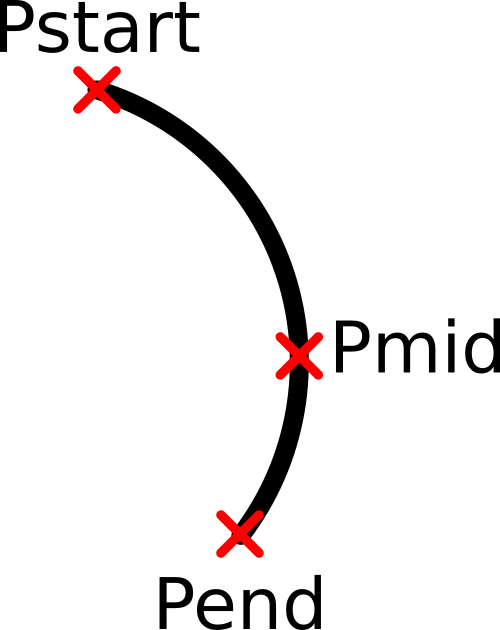
- Parameters:
parent (inkscape element object) – parent object
Pstart (list) –
Start coordinate [x,y]
Warning
Keep in mind that Inkscape’s y axis is upside down!
Pmid (list) – Mid coordinate [x,y]
Pend (list) – End coordinate [x,y]
offset (list) – Extra offset coords [x,y]
label (string) – Label of the line. Default ‘arc’
lineStyle (lineStyle object) – Line style to be used. See
lineStyleclass. Default: lineStyle=lineStyle.setSimpleBlack()arcType (string) – Type of arc. Valid values: ‘open’, ‘slice’, ‘chord’. See image below. Default: ‘open’
- Returns:
the new arc object
- Return type:
line Object
Arc options
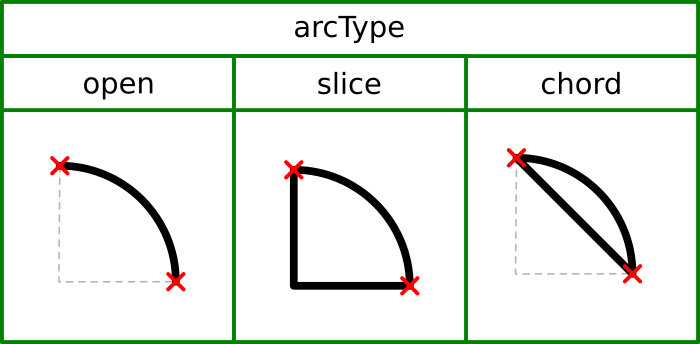
Example
>>> root_layer = self.document.getroot()     # retrieves the root layer of the document
>>> myLineStyle = inkDraw.lineStyle.setSimpleBlack()
>>>
>>> P1=[10.0,0.0]
>>> P2=[20.0,10.0]
>>> P3=[50.0,30.0]
>>>
>>> #draws an open arc
>>> inkDraw.arc.threePoints(parent=root_layer, Pstart=P1, Pmid=P3, Pend=P3, offset=[25,0], label='arc1',  lineStyle=myLineStyle, arcType='open')
- class inkscapeMadeEasy_Draw.circle[source]
Bases:
objectClass with methods for drawing circles.
Note
This class contains only static methods so that your plugin class don’t have to inherit it.
- static centerRadius(parent, centerPoint, radius, offset=[0, 0], label='circle', lineStyle={'fill': 'none', 'fill-opacity': '1.0', 'stroke': '#000000', 'stroke-dasharray': 'none', 'stroke-linecap': 'round', 'stroke-linejoin': 'round', 'stroke-opacity': '1.0', 'stroke-width': '1.0'})[source]
Draw a circle given its center point and radius
- Parameters:
parent (inkscape element object) – Parent object
centerPoint (list) –
Center coordinate [x,y]
Warning
Keep in mind that Inkscape’s y axis is upside down!
radius (float) – Circle’s radius
offset (list) – Extra offset coords [x,y]
label (string) – Label of the line. Default ‘circle’
lineStyle (lineStyle object) – Line style to be used. See
lineStyleclass. Default: lineStyle=lineStyle.setSimpleBlack()
- Returns:
the new circle object
- Return type:
line Object
Example
>>> root_layer = self.document.getroot()     # retrieves the root layer of the document
>>> myLineStyle = inkDraw.lineStyle.setSimpleBlack()
>>>
>>> inkDraw.circle.centerRadius(parent=root_layer, centerPoint=[0,0], radius=15.0, offset=[5,1], label='circle1', lineStyle=myLineStyle)
- static threePoints(parent, P1, P2, P3, offset=[0, 0], label='circle', lineStyle={'fill': 'none', 'fill-opacity': '1.0', 'stroke': '#000000', 'stroke-dasharray': 'none', 'stroke-linecap': 'round', 'stroke-linejoin': 'round', 'stroke-opacity': '1.0', 'stroke-width': '1.0'})[source]
Draw a circle given 3 poins on the circle.
The function checks if the 3 points are aligned. In this case, no circle is drawn.
- Parameters:
parent (inkscape element object) – parent object
P1 (list) – point coordinates [x,y]
P2 (list) – point coordinates [x,y]
P3 (list) –
point coordinates [x,y]
Warning
Keep in mind that Inkscape’s y axis is upside down!
offset (list) – Extra offset coords [x,y]
label (string) – Label of the line. Default ‘arc’
lineStyle (lineStyle object) – Line style to be used. See
lineStyleclass. Default: lineStyle=lineStyle.setSimpleBlack()
- Returns:
the new circle object
- Return type:
line Object
Example
>>> root_layer = self.document.getroot()     # retrieves the root layer of the document
>>> myLineStyle = inkDraw.lineStyle.setSimpleBlack()
>>>
>>> inkDraw.circle.threePoints(parent=root_layer, P1=[0,0], P2=[30,40], P3=[-20,20], offset=[0,0], label='circle1', lineStyle=myLineStyle)
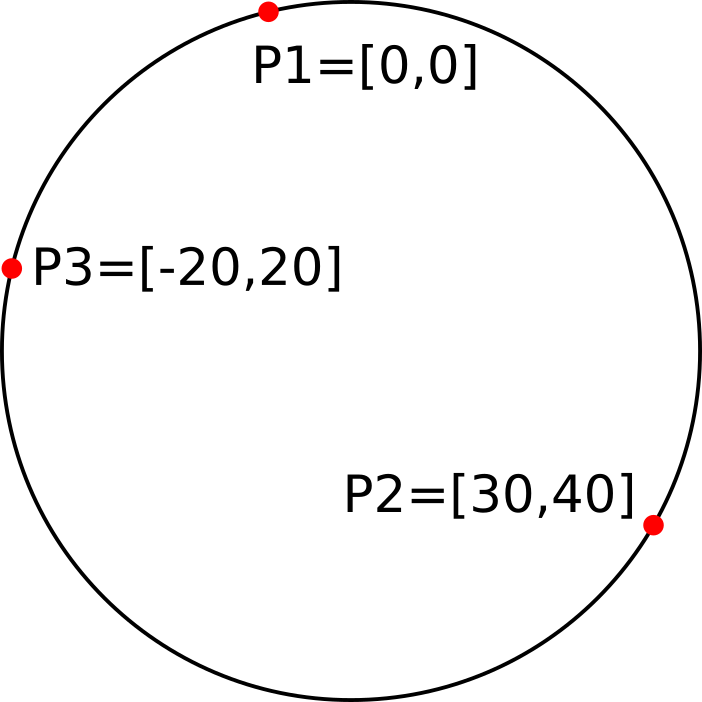
- class inkscapeMadeEasy_Draw.rectangle[source]
Bases:
objectClass with methods for drawing rectangles.
Note
This class contains only static methods so that your plugin class don’t have to inherit it.
- static widthHeightCenter(parent, centerPoint, width, height, radiusX=None, radiusY=None, offset=[0, 0], label='rectangle', lineStyle={'fill': 'none', 'fill-opacity': '1.0', 'stroke': '#000000', 'stroke-dasharray': 'none', 'stroke-linecap': 'round', 'stroke-linejoin': 'round', 'stroke-opacity': '1.0', 'stroke-width': '1.0'})[source]
Draw a rectangle given its center point and dimensions
- Parameters:
parent (inkscape element object) – Parent object
centerPoint (list) –
Center coordinate [x,y]
Warning
Keep in mind that Inkscape’s y axis is upside down!
width (float) – Dimension in X direction
height (float) – Dimension in Y direction
radiusX (float) – Rounding radius in X direction. If this value is
None, the rectangle will have sharp corners. Default: NoneradiusY (float) – Rounding radius in Y direction. - If
None, then radiusX will also be used in Y direction. - IfNoneand radiusX is alsoNone, then the rectangle will have sharp corners. Default: Noneoffset (list) – Extra offset coords [x,y]
label (string) – Label of the line. Default ‘circle’
lineStyle (lineStyle object) – Line style to be used. See
lineStyleclass. Default: lineStyle=lineStyle.setSimpleBlack()
- Returns:
the new rectangle object
- Return type:
rectangle Object
Example
>>> root_layer = self.document.getroot()     # retrieves the root layer of the document
>>> myLineStyle=inkDraw.lineStyle.setSimpleBlack()
>>>
>>> #draws a 50x60 rectangle with radiusX=2.0 and radiusY=3.0
>>> inkDraw.rectangle.widthHeightCenter(parent=root_layer, centerPoint=[0,0], width=50, height=60, radiusX=2.0,radiusY=3.0, offset=[0,0], label='rect1', lineStyle=myLineStyle)
- static corners(parent, corner1, corner2, radiusX=None, radiusY=None, offset=[0, 0], label='rectangle', lineStyle={'fill': 'none', 'fill-opacity': '1.0', 'stroke': '#000000', 'stroke-dasharray': 'none', 'stroke-linecap': 'round', 'stroke-linejoin': 'round', 'stroke-opacity': '1.0', 'stroke-width': '1.0'})[source]
Draw a rectangle given the coordinates of two oposite corners
- Parameters:
parent (inkscape element object) – Parent object
corner1 (list) –
Coordinates of corner 1 [x,y]
Warning
Keep in mind that Inkscape’s y axis is upside down!
corner2 (list) – Coordinates of corner 2 [x,y]
radiusX (float) – Rounding radius in X direction. If this value is
None, the rectangle will have sharp corners. Default: NoneradiusY (float) – Rounding radius in Y direction. If this value is
None, then radiusX will also be used in Y direction. If radiusX is alsoNone, then the rectangle will have sharp corners. Default: Noneoffset (list) – Extra offset coords [x,y]
label (string) – Label of the line. Default ‘circle’
lineStyle (lineStyle object) – Line style to be used. See
lineStyleclass. Default: lineStyle=lineStyle.setSimpleBlack()
- Returns:
the new rectangle object
- Return type:
rectangle Object
Example
>>> root_layer = self.document.getroot()     # retrieves the root layer of the document
>>> myLineStyle=inkDraw.lineStyle.setSimpleBlack()
>>>
>>> #draws a rectangle with corners C1=[1,5] and C2=[6,10], with radiusX=2.0 and radiusY=3.0
>>> inkDraw.rectangle.corners(parent=root_layer, corner1=[1,5], corner2=[6,10], radiusX=2.0,radiusY=3.0, offset=[0,0], label='rect1',  lineStyle=myLineStyle)
- class inkscapeMadeEasy_Draw.ellipseArc[source]
Bases:
objectClass with methods for drawing arcs of ellipses.
Note
This class contains only static methods so that your plugin class don’t have to inherit it.
- static startEndRadius(parent, Pstart, Pend, radiusX=1.0, radiusY=2.0, offset=[0, 0], label='arc', lineStyle={'fill': 'none', 'fill-opacity': '1.0', 'stroke': '#000000', 'stroke-dasharray': 'none', 'stroke-linecap': 'round', 'stroke-linejoin': 'round', 'stroke-opacity': '1.0', 'stroke-width': '1.0'}, flagRightOf=True, arcType='open', largeArc=False)[source]
Draw an arc of ellipse, from
PstarttoPendwith a given radiusX and radiusY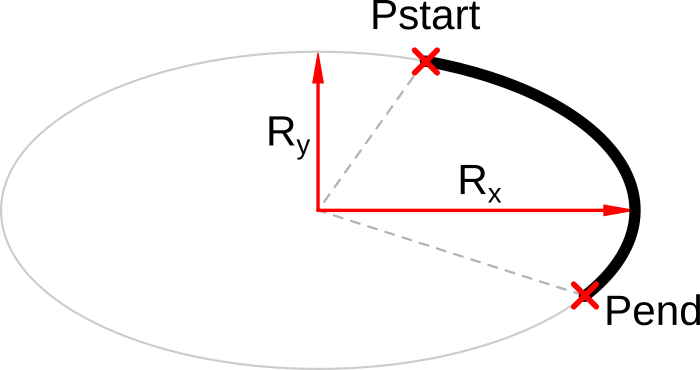
- Parameters:
parent (inkscape element object) – Parent object
Pstart (list) –
Start coordinate [x,y]
Warning
Keep in mind that Inkscape’s y axis is upside down!
Pend (list) – End coordinate [x,y]
radiusX (float) – Arc radius is X coordinate
radiusY (float) – Arc radius is Y coordinate
offset (list) – Extra offset coords [x,y]. Default [0,0]
label (string) – Label of the line. Default ‘arc’
lineStyle (lineStyle object) – Line style to be used. See
lineStyleclass. Default: lineStyle=lineStyle.setSimpleBlack()flagRightOf (bool) –
Sets the side of the vector Pend-Pstart which the arc must be drawn. See image below
True: Draws the arc to the right (Default)
False: Draws the arc to the left
arcType (string) – type of arc. Valid values: ‘open’, ‘slice’, ‘chord’. See image below. Default: ‘open’
largeArc (bool) –
Sets the largest arc to be drawn. See image below
True: Draws the largest arc
False: Draws the smallest arc (Default)
- Returns:
the new arc object
- Return type:
line Object
Arc options
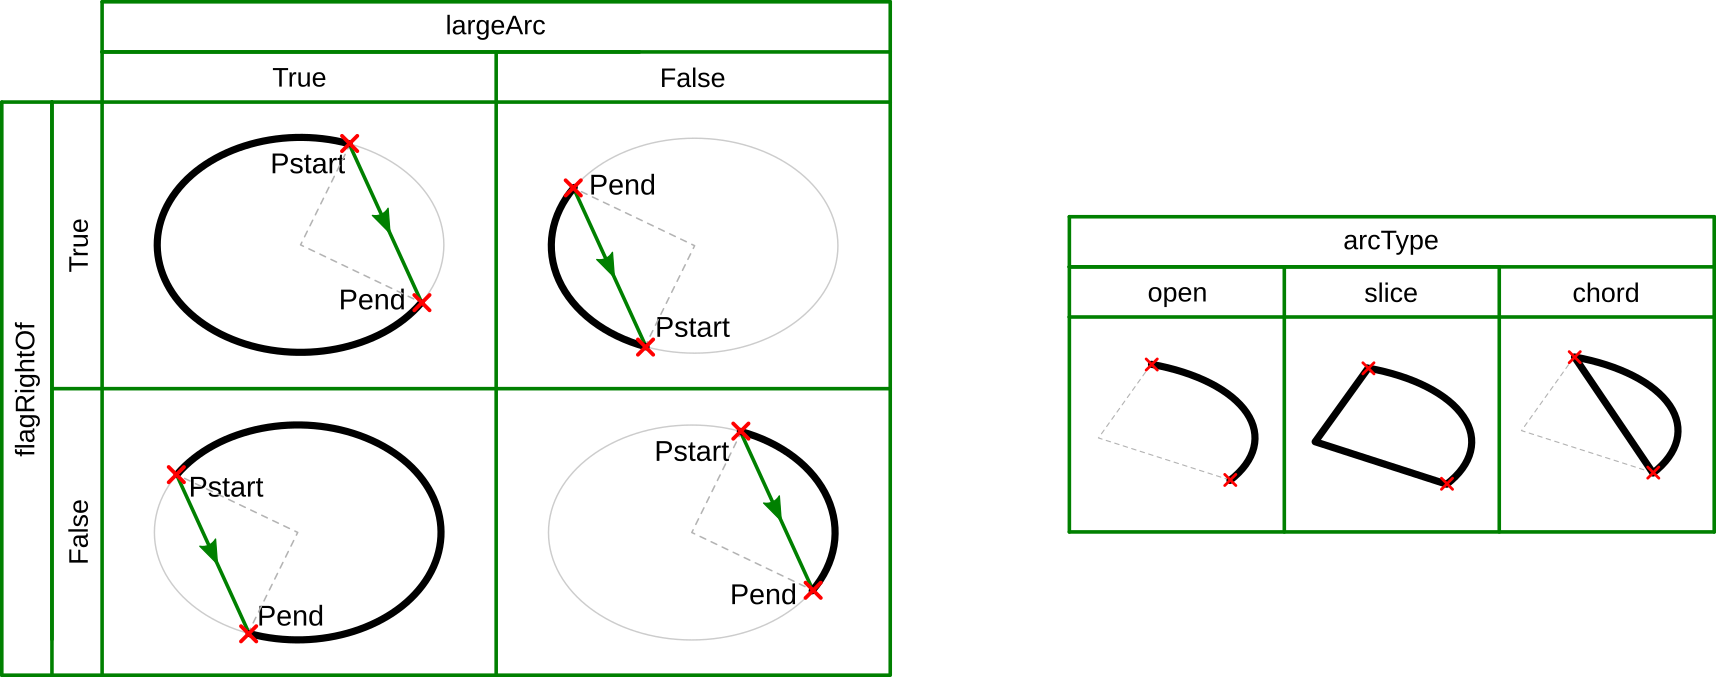
Example
>>> root_layer = self.document.getroot()     # retrieves the root layer of the document
>>>
>>> P1=[10.0,0.0]
>>> P2=[20.0,10.0]
>>> Rx=15.0
>>  Ry=20.0
>>> myLineStyle=inkDraw.lineStyle.setSimpleBlack()
>>>
>>> #draws an open arc
>>> inkDraw.ellipseArc.startEndRadius(parent=root_layer, Pstart=P1, Pend=P2, radiusX=Rx, radiusX=Ry, offset=[25,0], label='arc1',  lineStyle=myLineStyle, arcType='open')
>>>
>>> #draws a closed (slice) arc
>>> inkDraw.ellipseArc.startEndRadius(parent=root_layer, Pstart=P1, Pend=P2, radiusX=Rx, radiusX=Ry, offset=[25,20], label='arc2',  lineStyle=myLineStyle, arcType='slice')
>>>
>>> #draws an open arc to the right
>>> inkDraw.ellipseArc.startEndRadius(parent=root_layer, Pstart=P1, Pend=P2, radiusX=Rx, radiusX=Ry, offset=[0,0], label='arc',  lineStyle=myLineStyle, flagRightOf=True, largeArc=True)
- static centerAngStartAngEnd(parent, centerPoint, radiusX, radiusY, angStart, angEnd, offset=[0, 0], label='arc', lineStyle={'fill': 'none', 'fill-opacity': '1.0', 'stroke': '#000000', 'stroke-dasharray': 'none', 'stroke-linecap': 'round', 'stroke-linejoin': 'round', 'stroke-opacity': '1.0', 'stroke-width': '1.0'}, arcType='open', largeArc=False)[source]
Draw an arc of ellipse given its center and start and end angles
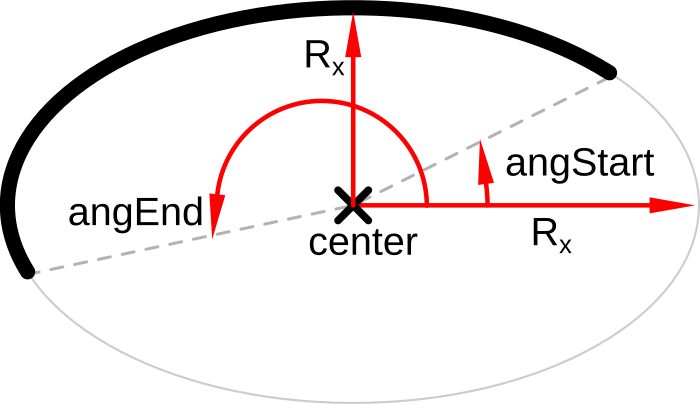
- Parameters:
parent (inkscape element object) – parent object
centerPoint (list) –
center coordinate [x,y]
Warning
Keep in mind that Inkscape’s y axis is upside down!
radiusX (float) – Arc radius is X coordinate
radiusY (float) – Arc radius is Y coordinate
angStart (float) – Start angle in degrees
angEnd (float) – End angle in degrees
offset (list) – Extra offset coords [x,y]
label (string) – Label of the line. Default ‘arc’
lineStyle (lineStyle object) – Line style to be used. See
lineStyleclass. Default: lineStyle=lineStyle.setSimpleBlack()arcType (string) – Type of arc. Valid values: ‘open’, ‘slice’, ‘chord’. See image below. Default: ‘open’
largeArc (bool) –
Sets the largest arc to be drawn. See image below
True: Draws the largest arc
False: Draws the smallest arc (Default)
- Returns:
the new arc object
- Return type:
line Object
Arc options
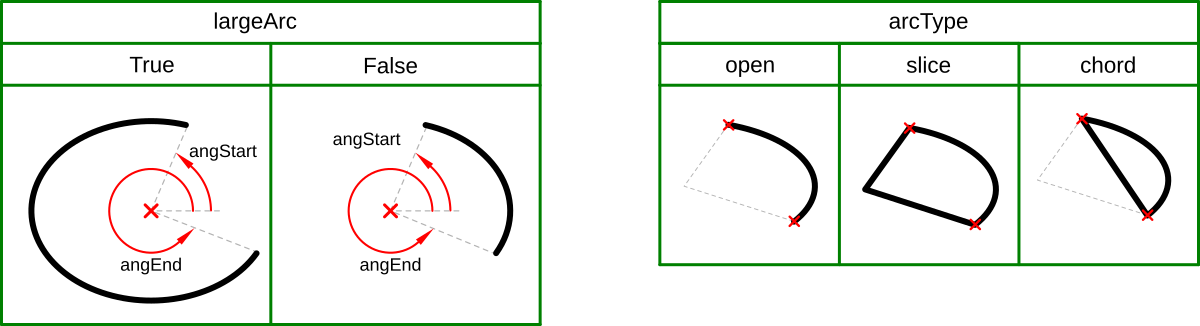
Example
>>> root_layer = self.document.getroot()     # retrieves the root layer of the document
>>> myLineStyle = inkDraw.lineStyle.setSimpleBlack()
>>>
>>> #draws the shortest arc
>>> inkDraw.ellipseArc.centerAngStartAngEnd(parent=root_layer, centerPoint=[0,0], radiusX=15.0, radiusY=25.0, angStart=-10, angEnd=90,
>>>                                         offset=[0,0], label='arc1',  lineStyle=myLineStyle, arcType='open',largeArc=False)
>>> #draws the longest arc
>>> inkDraw.ellipseArc.centerAngStartAngEnd(parent=root_layer, centerPoint=[0,0], radiusX=15.0, radiusY=25.0,, angStart=-10, angEnd=90,
>>>                                         offset=[30,0], label='arc1',  lineStyle=myLineStyle, arcType='open',largeArc=True)
- class inkscapeMadeEasy_Draw.ellipse[source]
Bases:
objectClass with methods for drawing ellipses.
Note
This class contains only static methods so that your plugin class don’t have to inherit it.
- static centerRadius(parent, centerPoint, radiusX, radiusY, offset=[0, 0], label='ellipse', lineStyle={'fill': 'none', 'fill-opacity': '1.0', 'stroke': '#000000', 'stroke-dasharray': 'none', 'stroke-linecap': 'round', 'stroke-linejoin': 'round', 'stroke-opacity': '1.0', 'stroke-width': '1.0'})[source]
Draw an ellipse given its center point and radii
- Parameters:
parent (inkscape element object) – Parent object
centerPoint (list) –
Center coordinate [x,y]
Warning
Keep in mind that Inkscape’s y axis is upside down!
radiusX (float) – Ellipse’s radius in x direction
radiusY (float) – Ellipse’s radius in y direction
offset (list) – Extra offset coords [x,y]
label (string) – Label of the line. Default ‘circle’
lineStyle (lineStyle object) – Line style to be used. See
lineStyleclass. Default: lineStyle=lineStyle.setSimpleBlack()
- Returns:
the new ellipse object
- Return type:
line Object
Example
>>> root_layer = self.document.getroot()     # retrieves the root layer of the document
>>> myLineStyle=inkDraw.lineStyle.setSimpleBlack()
>>>
>>> #draws the shortest arc
>>> inkDraw.ellipse.centerRadius(parent=root_layer, centerPoint=[0,0], radiusX=15.0, radiusY=25.0, offset=[5,1], label='circle1',  lineStyle=myLineStyle)
inkscapeMadeEasy_Plot
This module contains classes and functions to create plots
Important
Unless explicitly mentioned, all the code snippet presented in this section assume you are using inkscapeMadeEasy as presented in the Minimal example section and your are within the scope of your extension class and, therefore, can use self.[SOME_FUNCTION].
Note
in all examples, assume inkscapeMadeEasy modules are imported with the following aliases
1import inkscapeMadeEasy.inkscapeMadeEasy_Base as inkBase
2import inkscapeMadeEasy.inkscapeMadeEasy_Draw as inkDraw
3import inkscapeMadeEasy.inkscapeMadeEasy_Plot as inkPlot
- inkscapeMadeEasy_Plot.displayMsg(msg)[source]
Display a message to the user.
- Parameters:
msg (string) – message
- Returns:
nothing
- Return type:
Note
Identical function has been also defined inside
inkscapeMadeEasy_Base.inkscapeMadeEasy()class
- inkscapeMadeEasy_Plot.Dump(obj, file='./dump_file.txt', mode='w')[source]
Function to easily output the result of
str(obj)to a file- Parameters:
obj (any) – python object to sent to a file. Any object can be used, as long as
str(obj)is implemented (see__str__()metaclass definition of your object)file (string) – file path. Default:
./dump_file.txtmode (string) – writing mode of the file Default:
w(write)
- Returns:
nothing
- Return type:
Note
Identical function has been also defined inside
inkscapeMadeEasy_Base.inkscapeMadeEasy()classThis function was created to help debugging the code while it is running under inkscape. Since inkscape does not possess a terminal as today (2016), this function overcomes partially the issue of sending things to stdout by dumping result of the function
str()in a text file.Example
>>> vector1=[1,2,3,4,5,6]
>>> inkPlot.Dump(vector1,file='~/temporary.txt',mode='w')   # writes the list to a file
>>> vector2=[7,8,9,10]
>>> inkPlot.Dump(vector2,file='~/temporary.txt',mode='a')   # append the list to a file
- class inkscapeMadeEasy_Plot.axis[source]
Bases:
objectThis class has member functions to create customizable plot axes.
Note
This class contains only static methods so that your plugin class don’t have to inherit it.
Note
This class can use LaTeX to render text if LaTeX support is enabled. LaTeX support is an optional feature that requires a few extra packages to be installed outside inkscape. It is enabled by default. Please refer to Disabling LaTeX support on how to disable it. If disabled, this function will still work, internally calling the
inkscapeMadeEasy_Draw.text.write()to generate text.- static cartesian(ExtensionBaseObj, parent, xLim, yLim, position=[0, 0], xLabel='', yLabel='', xlog10scale=False, ylog10scale=False, xTicks=True, yTicks=True, xTickStep=1.0, yTickStep=1.0, xScale=20, yScale=20, xAxisUnitFactor='', yAxisUnitFactor='', xGrid=False, yGrid=False, forceTextSize=0, forceLineWidth=0, drawAxis=True, ExtraLengthAxisX=0.0, ExtraLengthAxisY=0.0)[source]
Creates the axes of a cartesian plot
Note
This method uses LaTeX in labels and tick marks if LaTeX support is enabled. This is an optional feature, enabled by default. Please refer to Disabling LaTeX support on how to disable it.
- Parameters:
ExtensionBaseObj (inkscapeMadeEasy object) – Most of the times you have to pass ‘self’ when calling from inside your plugin class. See example below
parent (inkscape element object) – Parent object
xLim (list) – Limits of the X axis [x_min,x_max]. If the axis is in log10 scale, then the limits will be rounded to complete one decade.
yLim (list) – Limits of the Y axis [y_min,y_max]. If the axis is in log10 scale, then the limits will be rounded to complete one decade.
position (list) –
Position of the plot. It is defined at the point where x and y axis cross [x0,y0]. The point where the axis cross depend on the limits.
If xLimits comprises the origin x=0, then the Y axis crosses the X axis at x=0.
If xLimits contains only negative numbers, then the Y axis crosses the X axis at x_max.
If xLimits contains only positive numbers, then the Y axis crosses the X axis at x_min.
The same rule applies to y direction.
xLabel (string) –
Label of the X axis. Default: ‘’
The text can contain any LaTeX command. If you want to write mathematical text, you can enclose it between dollar signs $…$. If LaTeX support is disabled, do not use $.
yLabel (string) –
Label of the Y axis. Default: ‘’
The text can contain any LaTeX command. If you want to write mathematical text, you can enclose it between dollar signs $…$. If LaTeX support is disabled, do not use $.
xlog10scale (bool) – Sets X axis to log10 scale if True. Default: False
ylog10scale (bool) – Sets Y axis to log10 scale if True. Default: False
xTicks (bool) – Adds axis ticks to the X axis if True. Default: True
yTicks (bool) – Adds axis ticks to the Y axis if True. Default: True
xTickStep (float) – Value interval between two consecutive ticks on X axis. (Not used if X axis is in log10 scale). Default:1.0
yTickStep (float) – Value interval between two consecutive ticks on Y axis. (Not used if Y axis is in log10 scale). Default:1.0
xScale (float) –
Distance between each xTickStep in svg units. Default: 20
If axis is linear, then xScale is the size in svg units of each tick
If axis is log10, the xScale is the size in svg units of one decade
yScale (float) –
Distance between each yTickStep in svg units. Default: 20
If axis is linear, then yScale is the size in svg units of each tick
If axis is log10, the yScale is the size in svg units of one decade
xAxisUnitFactor (string) –
Extra text to be added to the ticks in X axis. Default: ‘’
This is useful when we want to represent interval with different units. example pi, 2pi 3pi, etc. The text can be any LaTeX text. Keep in mind that this text will be inserted within a mathematical environment $…$, therefore no $ is needed here.
yAxisUnitFactor (string) –
Extra text to be added to the ticks in Y axis. Default: ‘’
This is useful when we want to represent interval with different units. example pi, 2pi 3pi, etc. The text can be any LaTeX text. Keep in mind that this text will be inserted within a mathematical environment $…$, therefore no $ is needed here.
xGrid (bool) – Adds grid lines to X axis if True. Default: False
yGrid (bool) – Adds grid lines to Y axis if True. Default: False
forceTextSize (float) – Size of the text. If this parameter is 0.0 then the method will compute an appropriate size. Default: 0.0
forceLineWidth (float) – Width of the lines. If this parameter is 0.0 then the method will compute an appropriate size. Default: 0.0
drawAxis (bool) –
Control flag of the axis method
True: draws axis normally
False: returns the limits and origin position without drawing the axis itself
ExtraLengthAxisX (float) – Extra length near the arrow pointer of X axis. Default 0.0
ExtraLengthAxisY (float) – Extra length near the arrow pointer of Y axis. Default 0.0
- Returns:
[GroupPlot, outputLimits, axisOrigin]
GroupPlot: the axis area object (if drawAxis=False, this output is
None)outputLimits: a list with tuples:[(x_min,xPos_min),(x_max,xPos_max),(y_min,yPos_min),(y_max,yPos_max)]
x_min, x_max, y_min, y_max: The limits of the axis object
xPos_min, xPos_max, yPos_min, yPos_max: The positions of the limits of the axis object, considering the scaling and units
axisOrigin [X0,Y0]: A list with the coordinates of the point where the axes cross.
- Return type:
list
Examples
>>> root_layer = self.document.getroot()     # retrieves the root layer of the document
>>>
>>> inkPlot.axis.cartesian(ExtensionBaseObj, parent=root_layer, xLim=[0,3], yLim=[0,2], position=[0, 0],
>>>                        xLabel='my label $x$', yLabel='my label $y$', xlog10scale=False, ylog10scale=False,
>>>                        xTicks=True, yTicks=True, xTickStep=0.5, yTickStep=1.0, xScale=50, yScale=60,
>>>                        xAxisUnitFactor='', yAxisUnitFactor='', xGrid=True, yGrid=True, forceTextSize=0, forceLineWidth=0,
>>>                        drawAxis=True, ExtraLengthAxisX=20.0, ExtraLengthAxisY=10.0)
The images below show the cartesian plane of the example above, together with other variations.
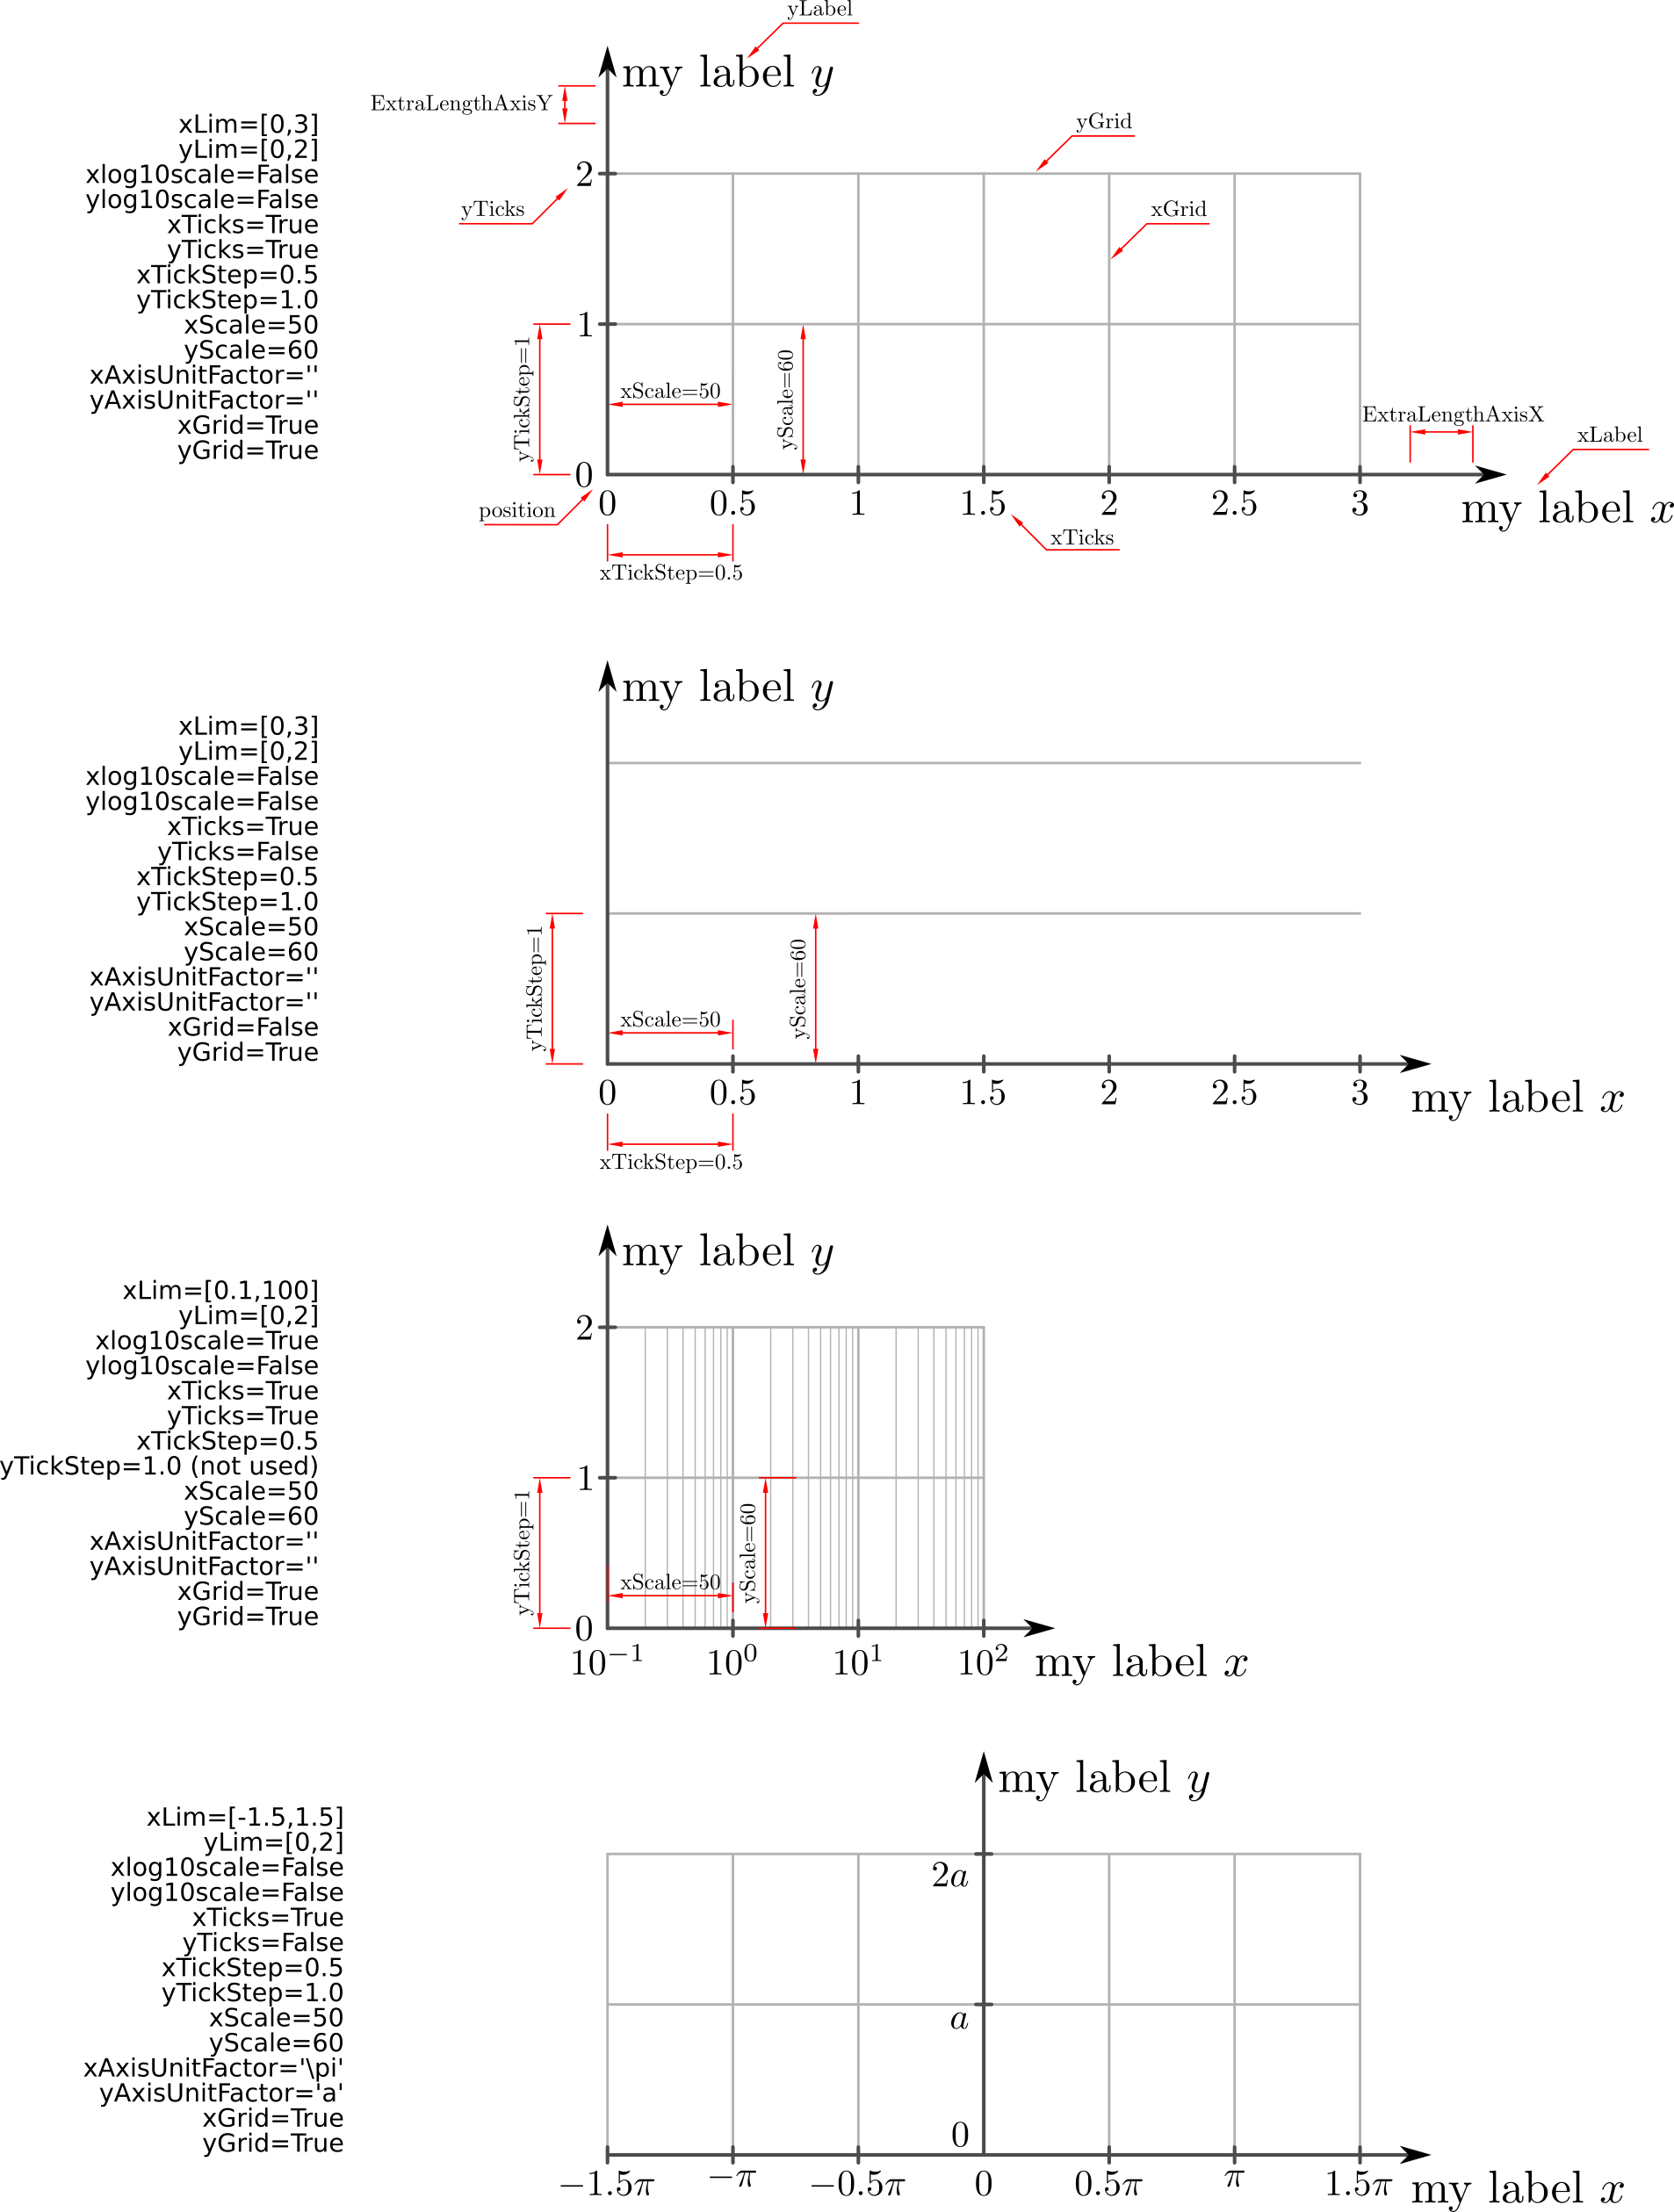
- static polar(ExtensionBaseObj, parent, rLim, tLim=[0.0, 360.0], position=[0.0, 0.0], rLabel='', rlog10scale=False, rTicks=True, tTicks=True, rTickStep=1.0, tTickStep=45.0, rScale=20, rAxisUnitFactor='', rGrid=False, tGrid=False, forceTextSize=0, forceLineWidth=0, drawAxis=True, ExtraLengthAxisR=0.0)[source]
Creates the axes of a polar plot
Note
This method uses LaTeX in labels and tick marks if LaTeX support is enabled. This is an optional feature, enabled by default. Please refer to Disabling LaTeX support on how to disable it.
- Parameters:
ExtensionBaseObj (inkscapeMadeEasy object) – Most of the times you have to pass ‘self’ when calling from inside your plugin class. See example below
parent (inkscape element object) – Parent object
rLim (list) – Limits of the R axis [r_min,r_max]. If the axis is in log10 scale, then the limits will be rounded to complete one decade.
tLim (list) – Limits of the theta axis [t_min,t_max]. Values in degrees. Default: [0,360]
position (list) – Position of the center [x0,y0].
rLabel (string) –
Label of the R axis. Default: ‘’
The text can contain any LaTeX command. If you want to write mathematical text, you can enclose it between dollar signs $…$. If LaTeX support is disabled, do not use $.
rlog10scale (bool) –
Sets R axis to log10 scale if True. Default: False
If rlog10scale=True, then the lower limit of rLim must be >=1
rTicks (bool) – Adds axis ticks to the R axis if True. Default: True
tTicks (bool) – Adds axis ticks to the theta axis if True. Default: True
rTickStep (float) – Value interval between two consecutive ticks on R axis. (Not used if R axis is in log10 scale). Default:1.0
tTickStep (float) – Value interval between two consecutive ticks on theta axis. Default:45.0
rScale (float) –
Distance between each rTickStep in svg units. Default: 20
If axis is linear, then rScale is the size in svg units of each tick
If axis is log10, the rScale is the size in svg units of one decade
rAxisUnitFactor (string) –
Extra text to be added to the ticks in R axis. Default: ‘’
This is useful when we want to represent interval with different units. example pi, 2pi 3pi, etc. The text can be any LaTeX text. Keep in mind that this text will be inserted within a mathematical environment $…$, therefore no $ is needed here.
rGrid (bool) – Adds grid lines to R axis if true. Default: False
tGrid (bool) – Adds grid lines to theta axis if true. Default: False
forceTextSize (float) – Size of the text. If this parameter is 0.0 then the method will compute an appropriate size. Default: 0.0
forceLineWidth (float) – Width of the lines. If this parameter is 0.0 then the method will compute an appropriate size. Default: 0.0
drawAxis (bool) –
Control flag of the axis method
True: draws axis normally
False: returns the limits and origin position without drawing the axis itself
ExtraLengthAxisR (float) – Extra length between the R axis and its label. Default 0.0
- Returns:
[GroupPlot, outputRLimits, axisOrigin]
GroupPlot: the axis area object (if drawAxis=False, this output is
None)outputRLimits: a list with tuples:[(r_min,rPos_min),(r_max,rPos_max)]
r_min, r_max : The limits of the axis object
rPos_min, rPos_max : The positions of the limits of the axis object, considering the scaling and units
axisOrigin [X0,Y0] : A list with the coordinates of the point where the axes cross.
- Return type:
list
Examples
>>> root_layer = self.document.getroot()     # retrieves the root layer of the document
>>>
>>> inkPlot.axis.cartesian(self, parent=root_layer, rLim=[0, 3], tLim=[0, 150], position=[0.0, 0.0], rLabel='my radius',
>>>                        rlog10scale=False, rTicks=True, tTicks=True, rTickStep=1.0, tTickStep=30.0, rScale=50,
>>>                        rAxisUnitFactor='', rGrid=True, tGrid=True, forceTextSize=0, forceLineWidth=0,
>>>                        drawAxis=True, ExtraLengthAxisR=10.0)
The images below show the cartesian plane of the example above, together with other variations.
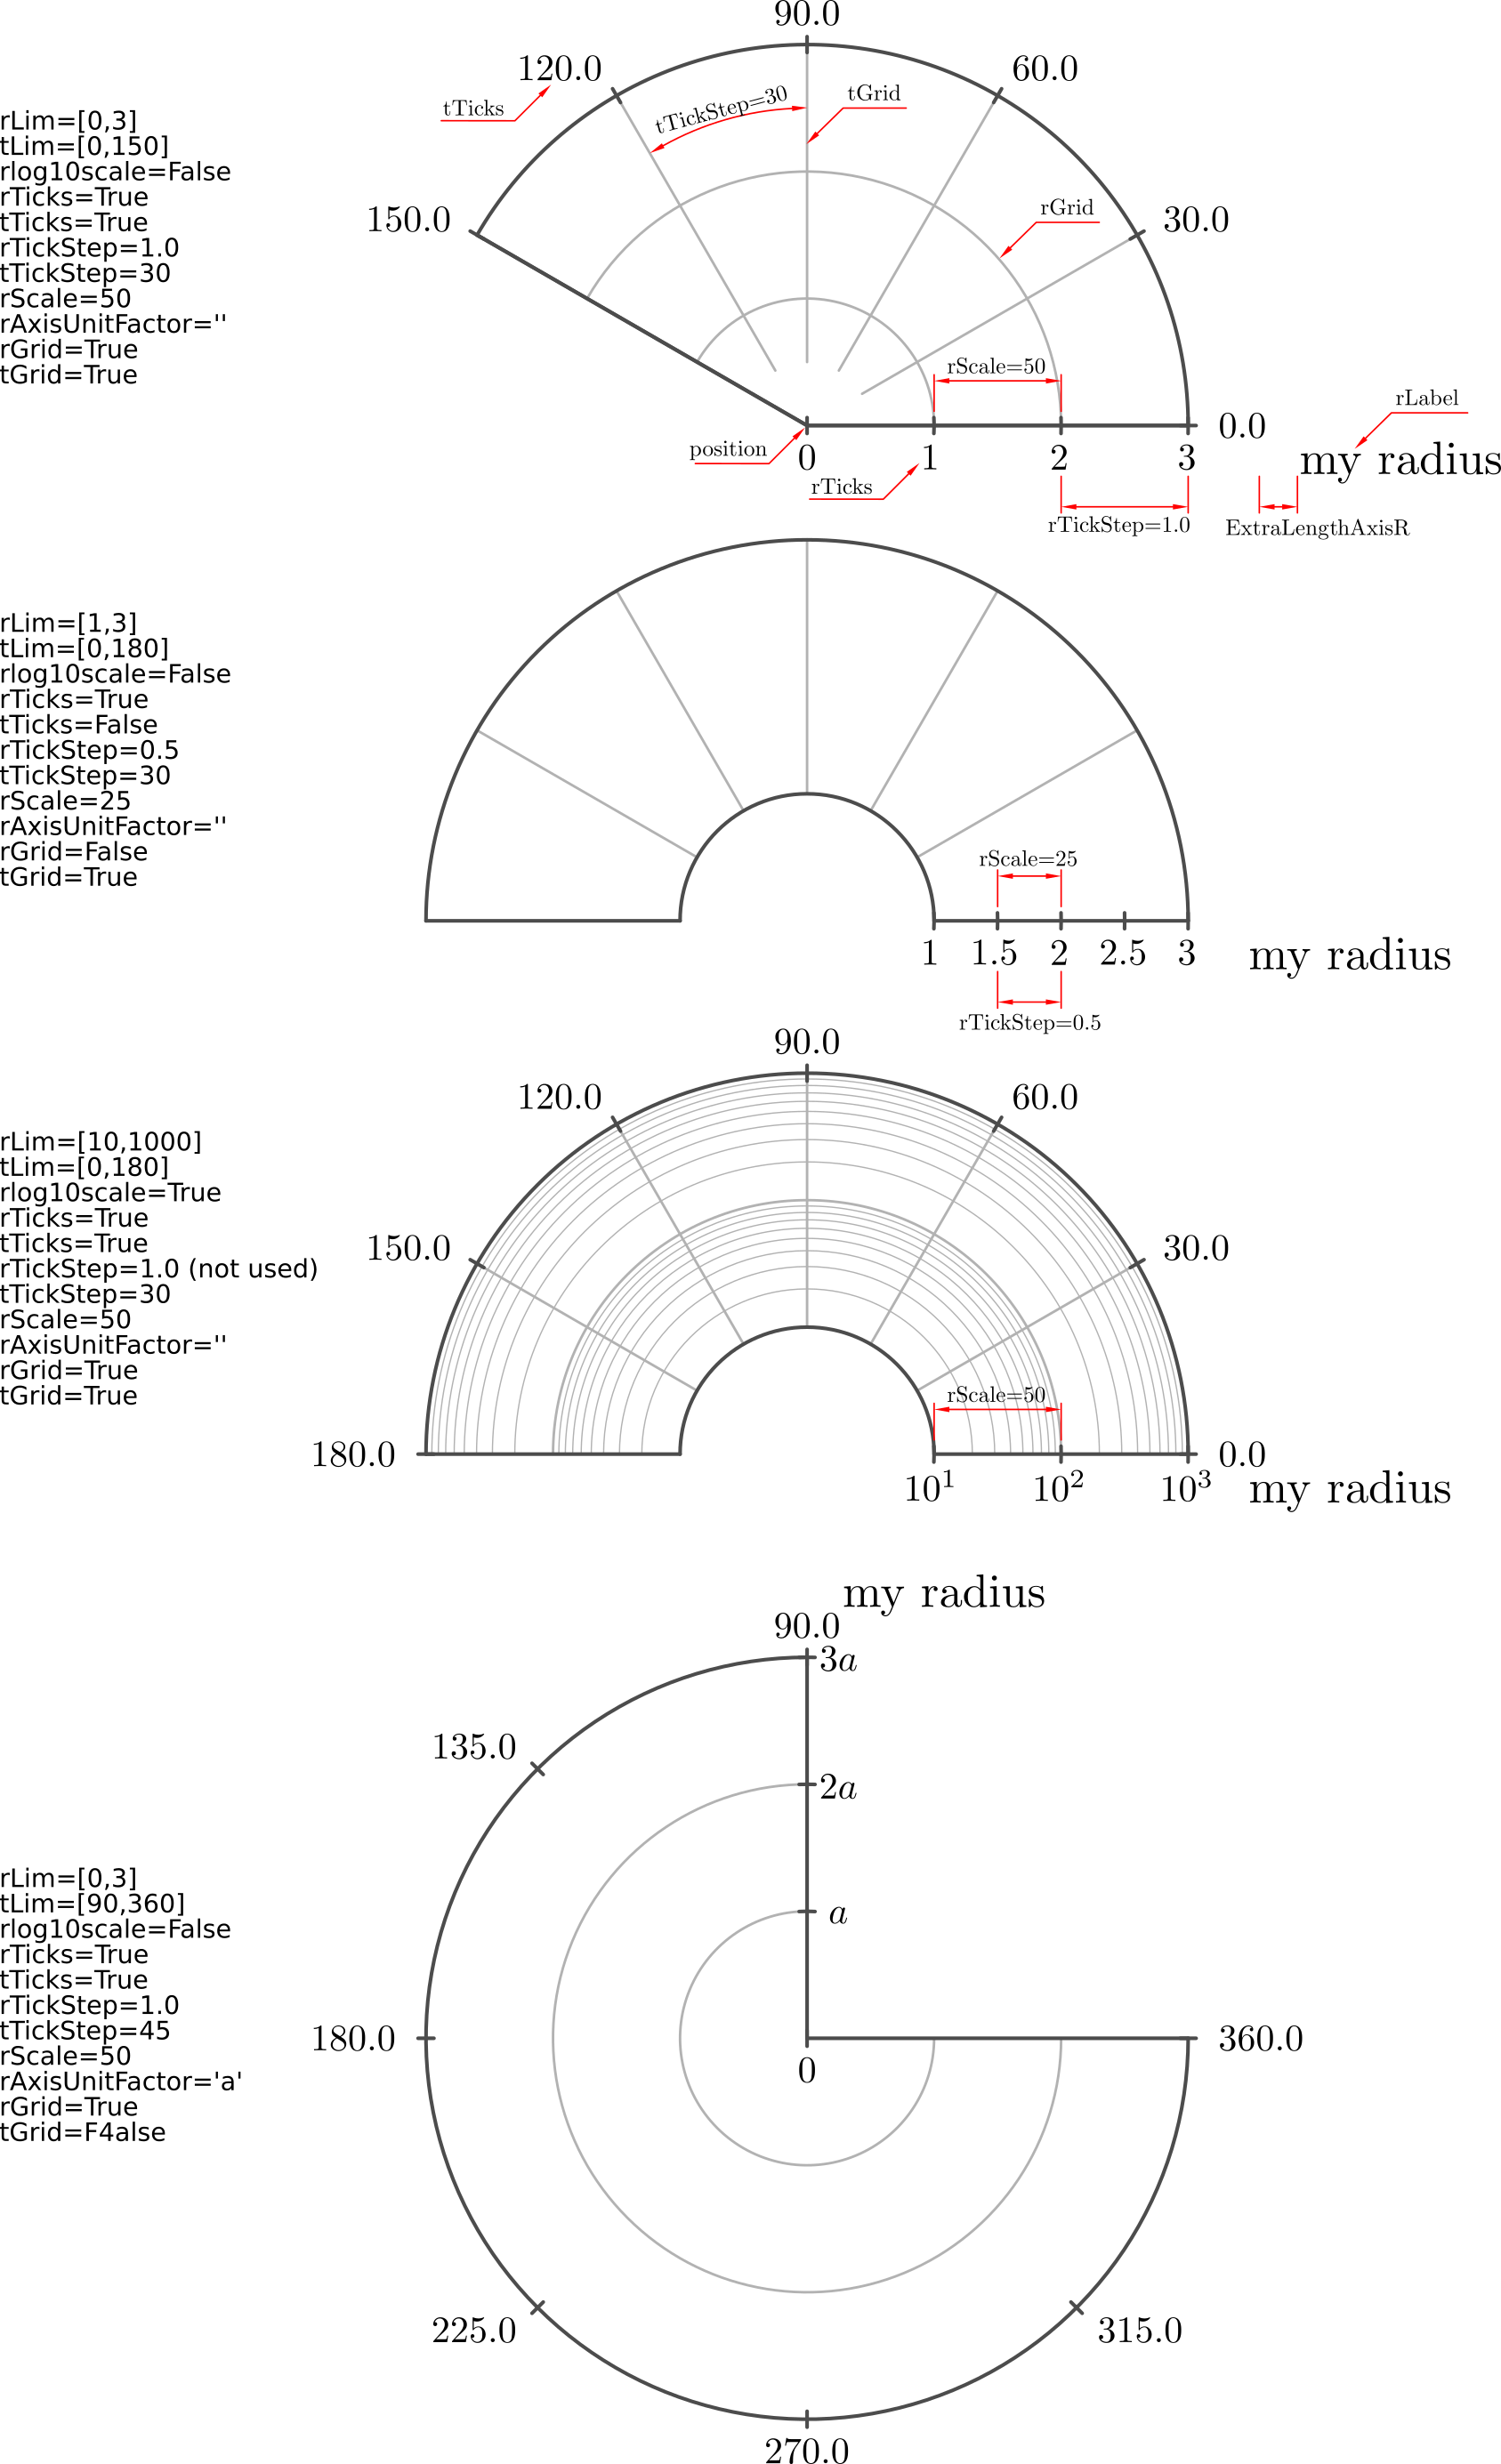
- class inkscapeMadeEasy_Plot.plot[source]
Bases:
objectThis class has member functions to create plots.
Note
This class contains only static methods so that your plugin class don’t have to inherit it.
Note
This class uses LaTeX in labels and tick marks if LaTeX support is enabled. This is an optional feature, enabled by default. Please refer to Disabling LaTeX support on how to disable it. If disabled, this function will still work, internally calling the
inkscapeMadeEasy_Draw.text.write()to generate text.- static cartesian(ExtensionBaseObj, parent, xData, yData, position=[0, 0], xLabel='', yLabel='', xlog10scale=False, ylog10scale=False, xTicks=True, yTicks=True, xTickStep=1.0, yTickStep=1.0, xScale=20, yScale=20, xExtraText='', yExtraText='', xGrid=False, yGrid=False, generalAspectFactorAxis=1.0, lineStylePlot=inkscapeMadeEasy.inkscapeMadeEasy_Draw.lineStyle.setSimpleBlack, forceXlim=None, forceYlim=None, drawAxis=True, ExtraLengthAxisX=0.0, ExtraLengthAxisY=0.0)[source]
Create a cartesian Plot
Note
This method uses LaTeX in labels and tick marks if LaTeX support is enabled. This is an optional feature, enabled by default. Please refer to Disabling LaTeX support on how to disable it.
- Parameters:
ExtensionBaseObj (inkscapeMadeEasy object) – Most of the times you have to pass ‘self’ when calling from inside your plugin class. See example below
parent (inkscape element object) – Parent object
xData (list) – List of x data
yData (list) – List of y data
position (list) –
Position of the plot. It is defined at the point where x and y axis cross [x0,y0]. The point where the axis cross depend on the limits.
If xLimits comprises the origin x=0, then the Y axis crosses the X axis at x=0.
If xLimits contains only negative numbers, then the Y axis crosses the X axis at x_max.
If xLimits contains only positive numbers, then the Y axis crosses the X axis at x_min.
The same rule applies to y direction.
xLabel (string) –
Label of the X axis. Default: ‘’
The text can contain any LaTeX command. If you want to write mathematical text, you can enclose it between dollar signs $…$. If LaTeX support is disabled, do not use $.
yLabel (string) –
Label of the Y axis. Default: ‘’
The text can contain any LaTeX command. If you want to write mathematical text, you can enclose it between dollar signs $…$. If LaTeX support is disabled, do not use $.
xlog10scale (bool) – Sets X axis to log10 scale if True. Default: False
ylog10scale (bool) – Sets Y axis to log10 scale if True. Default: False
xTicks (bool) – Adds axis ticks to the X axis if True. Default: True
yTicks (bool) – Adds axis ticks to the Y axis if True. Default: True
xTickStep (float) – Value interval between two consecutive ticks on X axis. (Not used if X axis is in log10 scale). Default:1.0
yTickStep (float) – Value interval between two consecutive ticks on Y axis. (Not used if Y axis is in log10 scale). Default:1.0
xScale (float) –
Distance between each xTickStep in svg units. Default: 20
If axis is linear, then xScale is the size in svg units of each tick
If axis is log10, the xScale is the size in svg units of one decade
yScale (float) –
Distance between each yTickStep in svg units. Default: 20
If axis is linear, then yScale is the size in svg units of each tick
If axis is log10, the yScale is the size in svg units of one decade
xExtraText (string) –
Extra text to be added to the ticks in X axis. Default: ‘’
This is useful when we want to represent interval with different units. example pi, 2pi 3pi, etc. The text can be any LaTeX text. Keep in mind that this text will be inserted within a mathematical environment $…$, therefore no $ is needed here.
yExtraText (string) –
Extra text to be added to the ticks in Y axis. Default: ‘’
This is useful when we want to represent interval with different units. example pi, 2pi 3pi, etc. The text can be any LaTeX text. Keep in mind that this text will be inserted within a mathematical environment $…$, therefore no $ is needed here.
xGrid (bool) – Adds grid lines to X axis if True. Default: False
yGrid (bool) – Adds grid lines to Y axis if True. Default: False
generalAspectFactorAxis (float) – Regulates the general aspect ratio between grid lines, text and Ticks separations. Default: 1.0
lineStylePlot (lineStyle object) – Line style to be used to plot the data. See class
inkscapeMadeEasy_Draw.lineStyle. Default: lineStylePlot=inkDraw.lineStyle.setSimpleBlack()forceXlim (list) –
Forces limits of X axis to these limits. These limits affect the axis only, that is, all xData is plotted despite of these limits.
if forceXlim=None Limits will be defined by the limits of xData (Default)
if forceXlim=[xMin,xMax] then these limits will be used.
Note
for logarithmic scale, the limits are always adjusted to complete the decade. Usually you don’t need this for logarithmic scale
forceYlim (list) –
Forces limits of Y axis to these limits. These limits affect the axis only, that is, all yData is plotted despite of these limits.
if forceYlim=None Limits will be defined by the limits of yData (Default)
if forceYlim=[yMin,yMax] then these limits will be used.
Note
for logarithmic scale, the limits are always adjusted to complete the decade. Usually you don’t need this for logarithmic scale
drawAxis (bool) –
Control flag of the axis method
True: draws axis normally
False: returns the limits and origin position without drawing the axis itself
ExtraLengthAxisX (float) – Extra length near the arrow pointer of X axis. Default 0.0
ExtraLengthAxisY (float) – Extra length near the arrow pointer of Y axis. Default 0.0
- Returns:
[GroupPlot, outputLimits, axisOrigin]
GroupPlot: the plot object
outputLimits: a list with tuples:[(x_min,xPos_min),(x_max,xPos_max),(y_min,yPos_min),(y_max,yPos_max)]
x_min, x_max, y_min, y_max: The limits of the axis object
xPos_min, xPos_max, yPos_min, yPos_max: The positions of the limits of the axis object, considering the scaling and units
axisOrigin [X0,Y0]: A list with the coordinates of the point where the axes cross.
- Return type:
list
Important
If any of the axis are log10, then the method ignores any pairs of (x,y) data with invalid coordinates, that is, if xData and/or yData is less than or equal to 0.0 (they would result in complex log10… =P ). The method will create a text object alongside your plot warning this.
Note
If any of the axis are linear, the method will ignore any value greater than 10.000 (in absolute value). This avoids plotting very large numbers. The method will create a text object alongside your plot warning this.
Example
>>> root_layer = self.document.getroot()     # retrieves the root layer of the document
>>> xData=[-1,-0.5,0,0.5,1.0,1.5,2]
>>> yData=[x*x for x in xData]    # computes y=x*x
>>> #create a lineStyle for the plot
>>> myMarkerDot=inkDraw.marker.createDotMarker(self,'DotM',RenameMode=2,scale=0.3,
>>>                                            strokeColor=inkDraw.color.defined('black'),fillColor=inkDraw.color.defined('black'))
>>> lineStyleDiscrete = inkDraw.lineStyle.set(lineWidth=1.0, markerStart=myMarkerDot,markerMid=myMarkerDot,markerEnd=myMarkerDot)
>>>
>>> inkPlot.plot.cartesian(self,root_layer,xData,yData,position=[0,0],
>>>                        xLabel='my $x$ data',yLabel='$y(x)$',xlog10scale=False,ylog10scale=False,
>>>                        xTicks=True,yTicks=True,xTickStep=0.5,yTickStep=2.0,
>>>                        xScale=20,yScale=10,xExtraText='a',yExtraText='',
>>>                        xGrid=True,yGrid=True,generalAspectFactorAxis=1.0,lineStylePlot=lineStyleDiscrete,
>>>                        forceXlim=None,forceYlim=None,drawAxis=True)
The image below present the plot above with a few argument variations.
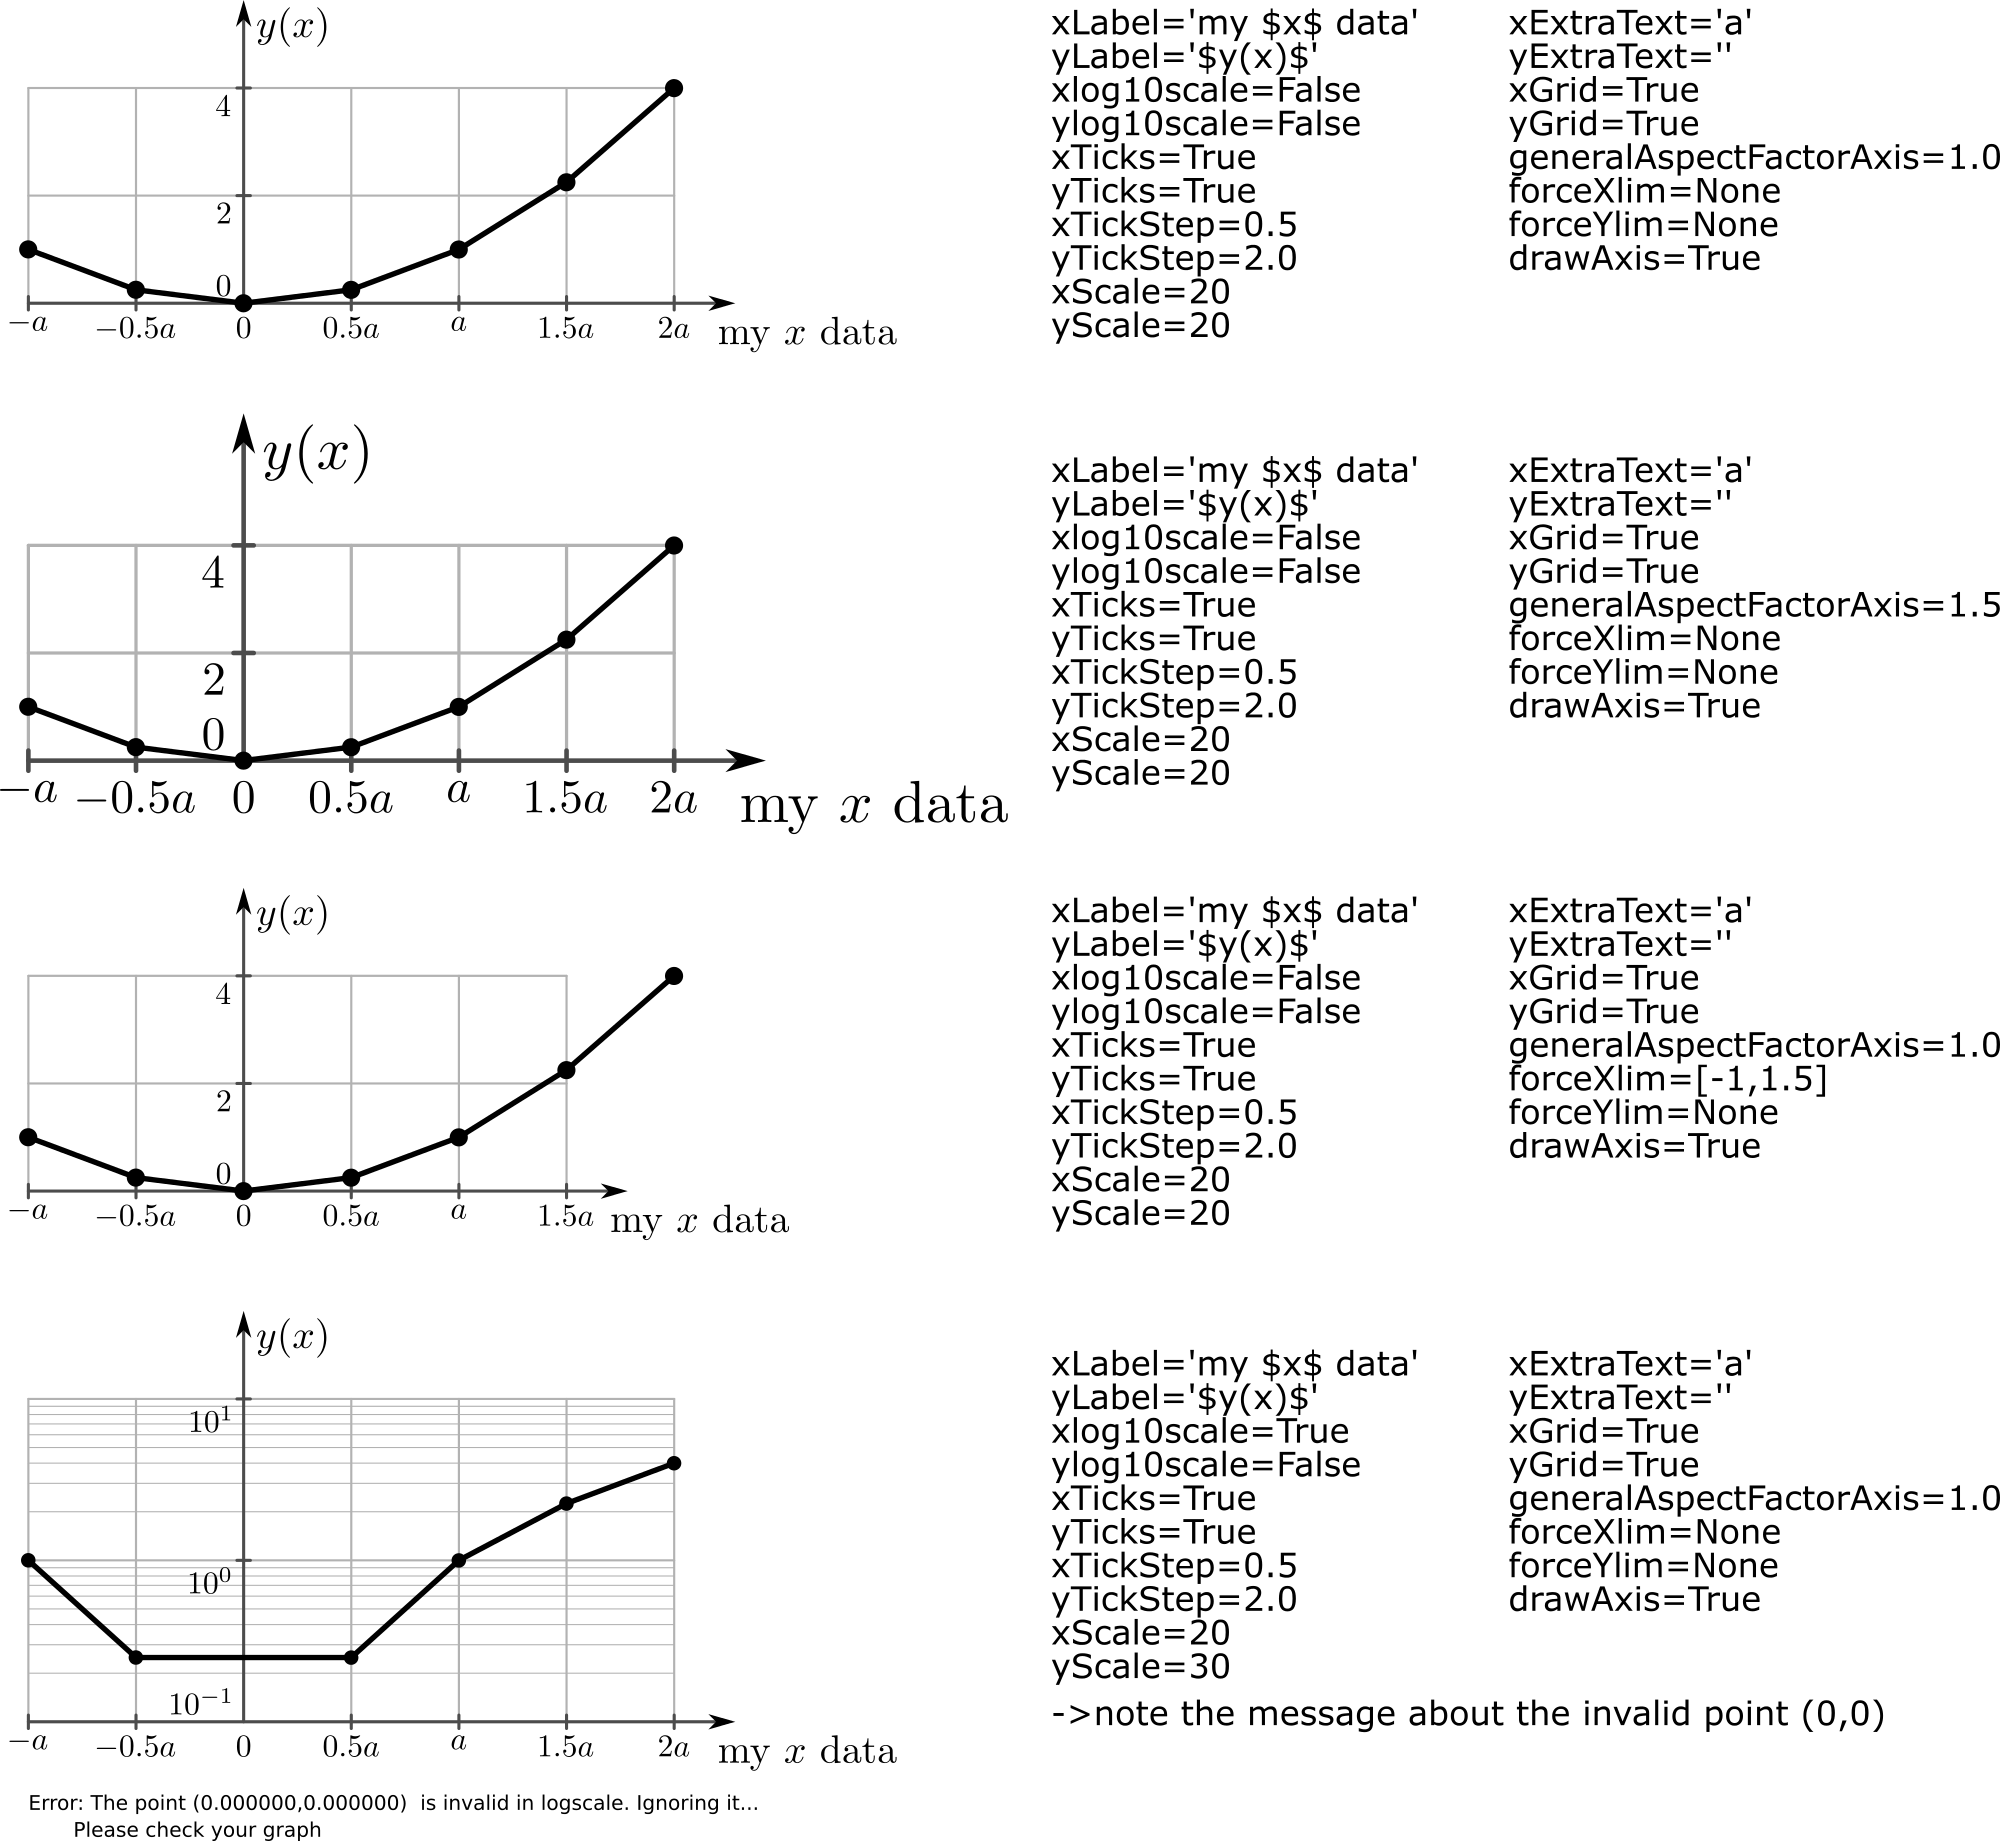
- static polar(ExtensionBaseObj, parent, rData, tData, position=[0, 0], rLabel='', rlog10scale=False, rTicks=True, tTicks=True, rTickStep=1.0, tTickStep=45.0, rScale=20, rExtraText='', rGrid=False, tGrid=False, generalAspectFactorAxis=1.0, lineStylePlot=inkscapeMadeEasy.inkscapeMadeEasy_Draw.lineStyle.setSimpleBlack, forceRlim=None, forceTlim=None, drawAxis=True, ExtraLengthAxisR=0.0)[source]
Create a polar Plot
Note
This method uses LaTeX in labels and tick marks if LaTeX support is enabled. This is an optional feature, enabled by default. Please refer to Disabling LaTeX support on how to disable it.
- Parameters:
ExtensionBaseObj (inkscapeMadeEasy object) – Most of the times you have to pass ‘self’ when calling from inside your plugin class. See example below
parent (inkscape element object) – Parent object
rData (list) – List of R data
tData (list) – List of Theta data
position (list) – Position of the plot [x0,y0]. It is defined at the center point
rLabel (string) –
Label of the R axis. Default: ‘’
The text can contain any LaTeX command. If you want to write mathematical text, you can enclose it between dollar signs $…$. If LaTeX support is disabled, do not use $.
rlog10scale (bool) – Sets R axis to log10 scale if True. Default: False
rTicks (bool) – Adds axis ticks to the R axis if True. Default: True
tTicks (bool) – Adds axis ticks to the Theta axis if True. Default: True
rTickStep (float) – Value interval between two consecutive ticks on R axis. (Not used if R axis is in log10 scale). Default:1.0
tTickStep (float) – Value interval between two consecutive ticks on Theta axis.
rScale (float) –
Distance between each rTickStep in svg units. Default: 20
If axis is linear, then rScale is the size in svg units of each tick
If axis is log10, the rScale is the size in svg units of one decade
rExtraText (string) –
Extra text to be added to the ticks in R axis. Default: ‘’
This is useful when we want to represent interval with different units. example pi, 2pi 3pi, etc. The text can be any LaTeX text. Keep in mind that this text will be inserted within a mathematical environment $…$, therefore no $ is needed here.
rGrid (bool) – Adds grid lines to R axis if True. Default: False
tGrid (bool) – Adds grid lines to Theta axis if True. Default: False
generalAspectFactorAxis (float) – Regulates the general aspect ratio between grid lines, text and Ticks separations. Default: 1.0
lineStylePlot (lineStyle object) – Line style to be used to plot the data. See class
inkscapeMadeEasy_Draw.lineStyle. Default: lineStylePlot=inkDraw.lineStyle.setSimpleBlack()forceRlim (list) –
Forces limits of R axis to these limits. These limits affect the axis only, that is, all rData is plotted despite of these limits.
if forceRlim=None Limits will be defined by the limits of rData (Default)
if forceRlim=[rMin,rMax] then these limits will be used.
Note
for logarithmic scale, the limits are always adjusted to complete the decade. Usually you don’t need this for logarithmic scale
forceTlim (list) –
Forces limits of Theta axis to these limits. These limits affect the axis only, that is, all tData is plotted despite of these limits.
if forceTlim=None Limits will be defined by min and max of tData (Default)
if forceTlim=[tMin,tMax] then these limits will be used.
drawAxis (bool) –
Control flag of the axis method
True: draws axis normally
False: returns the limits and origin position without drawing the axis itself
ExtraLengthAxisR (float) – Extra length near the arrow pointer of R axis. Default 0.0
- Returns:
[GroupPlot, outputLimits, axisOrigin]
GroupPlot: the plot object
outputLimits: a list with tuples:[(x_min,xPos_min),(x_max,xPos_max),(y_min,yPos_min),(y_max,yPos_max)]
x_min, x_max, y_min, y_max: The limits of the axis object
xPos_min, xPos_max, yPos_min, yPos_max: The positions of the limits of the axis object, considering the scaling and units
axisOrigin [X0,Y0]: A list with the coordinates of the point where the axes cross.
- Return type:
list
Important
If any of the axis are log10, then the method ignores any pairs of (x,y) data with invalid coordinates, that is, if rData and/or tData is less than or equal to 0.0 (they would result in complex log10… =P ). The method will create a text object alongside your plot warning this.
Note
If any of the axis are linear, the method will ignore any value greater than 10.000 (in absolute value). This avoids plotting very large numbers. The method will create a text object alongside your plot warning this.
Example
>>> root_layer = self.document.getroot()     # retrieves the root layer of the document
>>> rData=[1, 2, 3, 4, 5, 6, 7, 8, 9, 10,11,12]
>>> tData=[30*x for x in range(12)]
>>>
>>> myMarkerDot=inkDraw.marker.createDotMarker(self,'DotM',RenameMode=2,scale=0.3,
>>>                                            strokeColor=inkDraw.color.defined('black'),fillColor=inkDraw.color.defined('black'))
>>> lineStyleDiscrete = inkDraw.lineStyle.set(lineWidth=1.0,linecolor=inkDraw.color.defined('red'),
>>>                                           markerStart=myMarkerDot,markerMid=myMarkerDot,markerEnd=myMarkerDot)
>>>
>>> inkPlot.plot.polar(self,root_layer,rData,tData,position=[0,0],
>>>                    rLabel='my $R$ data',rlog10scale=False,
>>>                    rTicks=True,tTicks=True,rTickStep=2,tTickStep=30,
>>>                    rScale=20,rExtraText='a',
>>>                    rGrid=True,tGrid=True,generalAspectFactorAxis=1.0,lineStylePlot=lineStyleDiscrete,
>>>                    forceRlim=None,forceTlim=None,drawAxis=True)
>>>
>>> # another spiral, comprising two turns
>>> tData=[2*x for x in range(360)]
>>> rData=[x/180.0 for x in tData]
>>>
>>> inkPlot.plot.polar(self,root_layer,rData,tData,position=[0,0],
>>>                    rLabel='my $R$ data',rlog10scale=False,
>>>                    rTicks=True,tTicks=True,rTickStep=2,tTickStep=30,
>>>                    rScale=20,rExtraText='',
>>>                    rGrid=True,tGrid=True,generalAspectFactorAxis=1.0,
>>>                    forceRlim=None,forceTlim=None,drawAxis=True)
The image below present the plot above with a few argument variations.
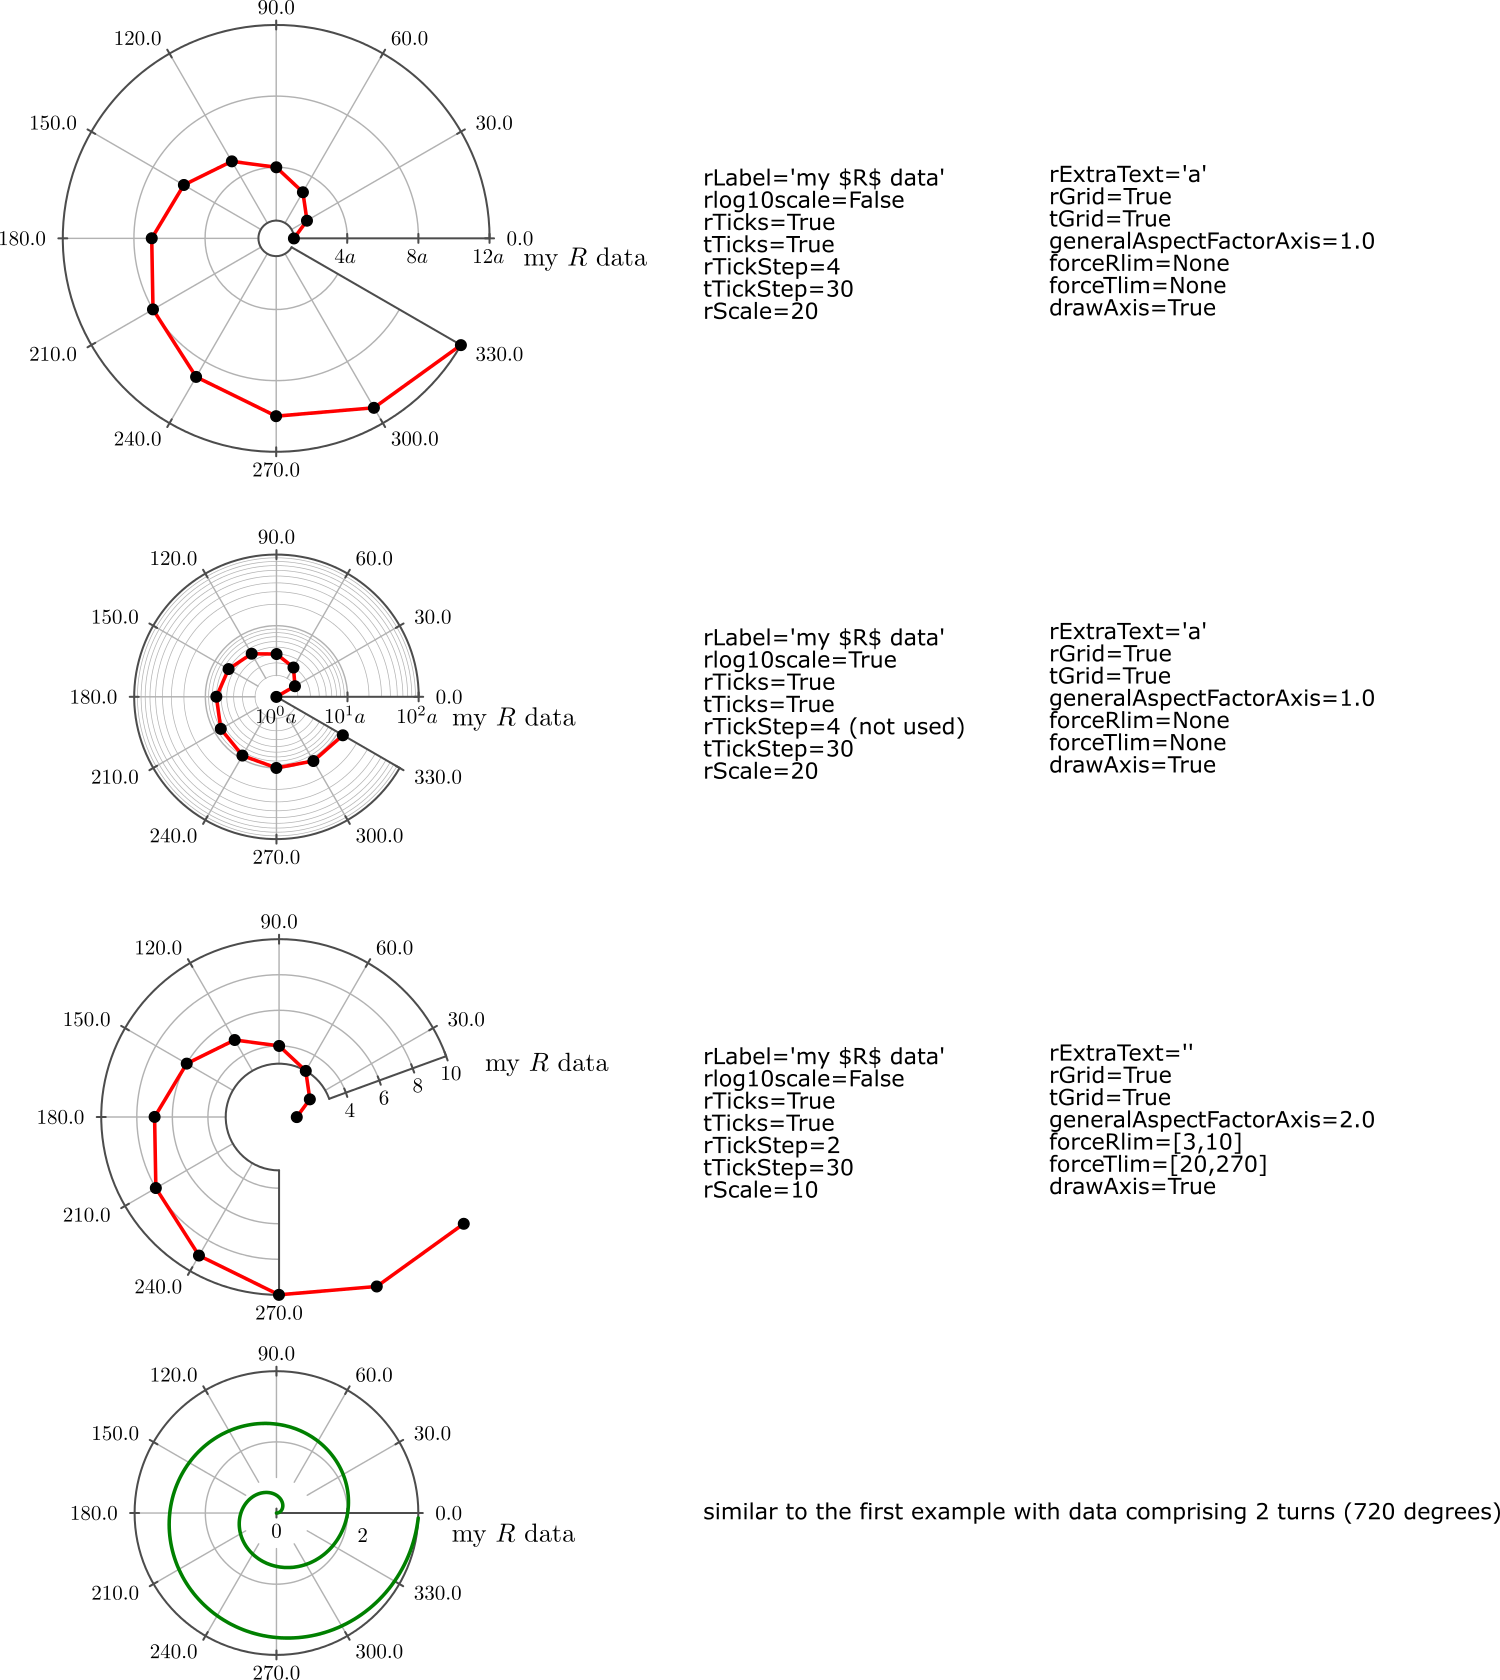
- static stem(ExtensionBaseObj, parent, xData, yData, position=[0, 0], xLabel='', yLabel='', ylog10scale=False, xTicks=True, yTicks=True, xTickStep=1.0, yTickStep=1.0, xScale=20, yScale=20, xExtraText='', yExtraText='', xGrid=False, yGrid=False, generalAspectFactorAxis=1.0, lineStylePlot=inkscapeMadeEasy.inkscapeMadeEasy_Draw.lineStyle.setSimpleBlack, forceXlim=None, forceYlim=None, drawAxis=True, ExtraLengthAxisX=0.0, ExtraLengthAxisY=0.0)[source]
Create a cartesian stem plot
Note
This method uses LaTeX in labels and tick marks if LaTeX support is enabled. This is an optional feature, enabled by default. Please refer to Disabling LaTeX support on how to disable it.
- Parameters:
ExtensionBaseObj (inkscapeMadeEasy object) – Most of the times you have to pass ‘self’ when calling from inside your plugin class. See example below
parent (inkscape element object) – Parent object
xData (list) – List of x data
yData (list) – List of y data
position (list) –
Position of the plot. It is defined at the point where x and y axis cross [x0,y0]. The point where the axis cross depend on the limits.
If xLimits comprises the origin x=0, then the Y axis crosses the X axis at x=0.
If xLimits contains only negative numbers, then the Y axis crosses the X axis at x_max.
If xLimits contains only positive numbers, then the Y axis crosses the X axis at x_min.
The same rule applies to y direction.
xLabel (string) –
Label of the X axis. Default: ‘’
The text can contain any LaTeX command. If you want to write mathematical text, you can enclose it between dollar signs $…$. If LaTeX support is disabled, do not use $.
yLabel (string) –
Label of the Y axis. Default: ‘’
The text can contain any LaTeX command. If you want to write mathematical text, you can enclose it between dollar signs $…$. If LaTeX support is disabled, do not use $.
ylog10scale (bool) – Sets Y axis to log10 scale if True. Default: False
xTicks (bool) – Adds axis ticks to the X axis if True. Default: True
yTicks (bool) – Adds axis ticks to the Y axis if True. Default: True
xTickStep (float) – Value interval between two consecutive ticks on X axis. (Not used if X axis is in log10 scale). Default:1.0
yTickStep (float) – Value interval between two consecutive ticks on Y axis. (Not used if Y axis is in log10 scale). Default:1.0
xScale (float) –
Distance between each xTickStep in svg units. Default: 20
If axis is linear, then xScale is the size in svg units of each tick
If axis is log10, the xScale is the size in svg units of one decade
yScale (float) –
Distance between each yTickStep in svg units. Default: 20
If axis is linear, then yScale is the size in svg units of each tick
If axis is log10, the yScale is the size in svg units of one decade
xExtraText (string) –
Extra text to be added to the ticks in X axis. Default: ‘’
This is useful when we want to represent interval with different units. example pi, 2pi 3pi, etc. The text can be any LaTeX text. Keep in mind that this text will be inserted within a mathematical environment $…$, therefore no $ is needed here.
yExtraText (string) –
Extra text to be added to the ticks in Y axis. Default: ‘’
This is useful when we want to represent interval with different units. example pi, 2pi 3pi, etc. The text can be any LaTeX text. Keep in mind that this text will be inserted within a mathematical environment $…$, therefore no $ is needed here.
xGrid (bool) – Adds grid lines to X axis if True. Default: False
yGrid (bool) – Adds grid lines to Y axis if True. Default: False
generalAspectFactorAxis (float) – Regulates the general aspect ratio between grid lines, text and Ticks separations. Default: 1.0
lineStylePlot (lineStyle object) – Line style to be used to plot the data. See class
inkscapeMadeEasy_Draw.lineStyle. Default: lineStylePlot=inkDraw.lineStyle.setSimpleBlack()forceXlim (list) –
Forces limits of X axis to these limits. These limits affect the axis only, that is, all xData is plotted despite of these limits.
- if forceXlim=None Limits will be defined by the limits of xData (Default)
if forceXlim=[xMin,xMax] then these limits will be used.
Note
for logarithmic scale, the limits are always adjusted to complete the decade. Usually you don’t need this for logarithmic scale
forceYlim (list) –
Forces limits of Y axis to these limits. These limits affect the axis only, that is, all yData is plotted despite of these limits.
- if forceYlim=None Limits will be defined by the limits of yData (Default)
if forceYlim=[yMin,yMax] then these limits will be used.
Note
for logarithmic scale, the limits are always adjusted to complete the decade. Usually you don’t need this for logarithmic scale
drawAxis (bool) –
Control flag of the axis method
True: draws axis normally
False: returns the limits and origin position without drawing the axis itself
ExtraLengthAxisX (float) – Extra length near the arrow pointer of X axis. Default 0.0
ExtraLengthAxisY (float) – Extra length near the arrow pointer of Y axis. Default 0.0
- Returns:
[GroupPlot, outputLimits, axisOrigin]
GroupPlot: the plot object
outputLimits: a list with tuples:[(x_min,xPos_min),(x_max,xPos_max),(y_min,yPos_min),(y_max,yPos_max)]
x_min, x_max, y_min, y_max: The limits of the axis object
xPos_min, xPos_max, yPos_min, yPos_max: The positions of the limits of the axis object, considering the scaling and units
axisOrigin [X0,Y0]: A list with the coordinates of the point where the axes cross.
- Return type:
list
Important
If any of the axis are log10, then the method ignores any pairs of (x,y) data with invalid coordinates, that is, if xData and/or yData is less than or equal to 0.0 (they would result in complex log10… =P ). The method will create a text object alongside your plot warning this.
Note
If any of the axis are linear, the method will ignore any value greater than 10.000 (in absolute value). This avoids plotting very large numbers. The method will create a text object alongside your plot warning this.
Example
>>> oot_layer = self.document.getroot()     # retrieves the root layer of the document
>>> xData=[-1,-0.5,0,0.5,1.0,1.5,2]
>>> yData=[x*x for x in xData]    # computes y=x*x
>>>
>>> # creates a line style with a dot marker for the stem plot
>>> myMarkerDot=inkDraw.marker.createDotMarker(self,'DotMDiscreteTime',RenameMode=2,scale=0.3,
>>>                                            strokeColor=inkDraw.color.defined('black'),fillColor=inkDraw.color.defined('red'))
>>> lineStyleDiscrete = inkDraw.lineStyle.set(lineWidth=1.0, markerEnd=myMarkerDot)
>>>
>>> inkPlot.plot.stem(self,root_layer,xData,yData,position=[0,0],
>>>                   xLabel='my $x$ data',yLabel='$y(x)$',ylog10scale=False,
>>>                   xTicks=True,yTicks=True,xTickStep=0.5,yTickStep=2.0,
>>>                   xScale=20,yScale=20,xExtraText='a',yExtraText='',
>>>                   xGrid=True,yGrid=True,generalAspectFactorAxis=1.0,lineStylePlot=lineStyleDiscrete,
>>>                   forceXlim=None,forceYlim=None,drawAxis=True)
The image below present the plot above.