Welcome to inkscapeMadeEasy’s documentation!
This set of python modules is intended to extend Aaron Spike’s inkex.py module, adding functions to help the development of new extensions for Inkscape.
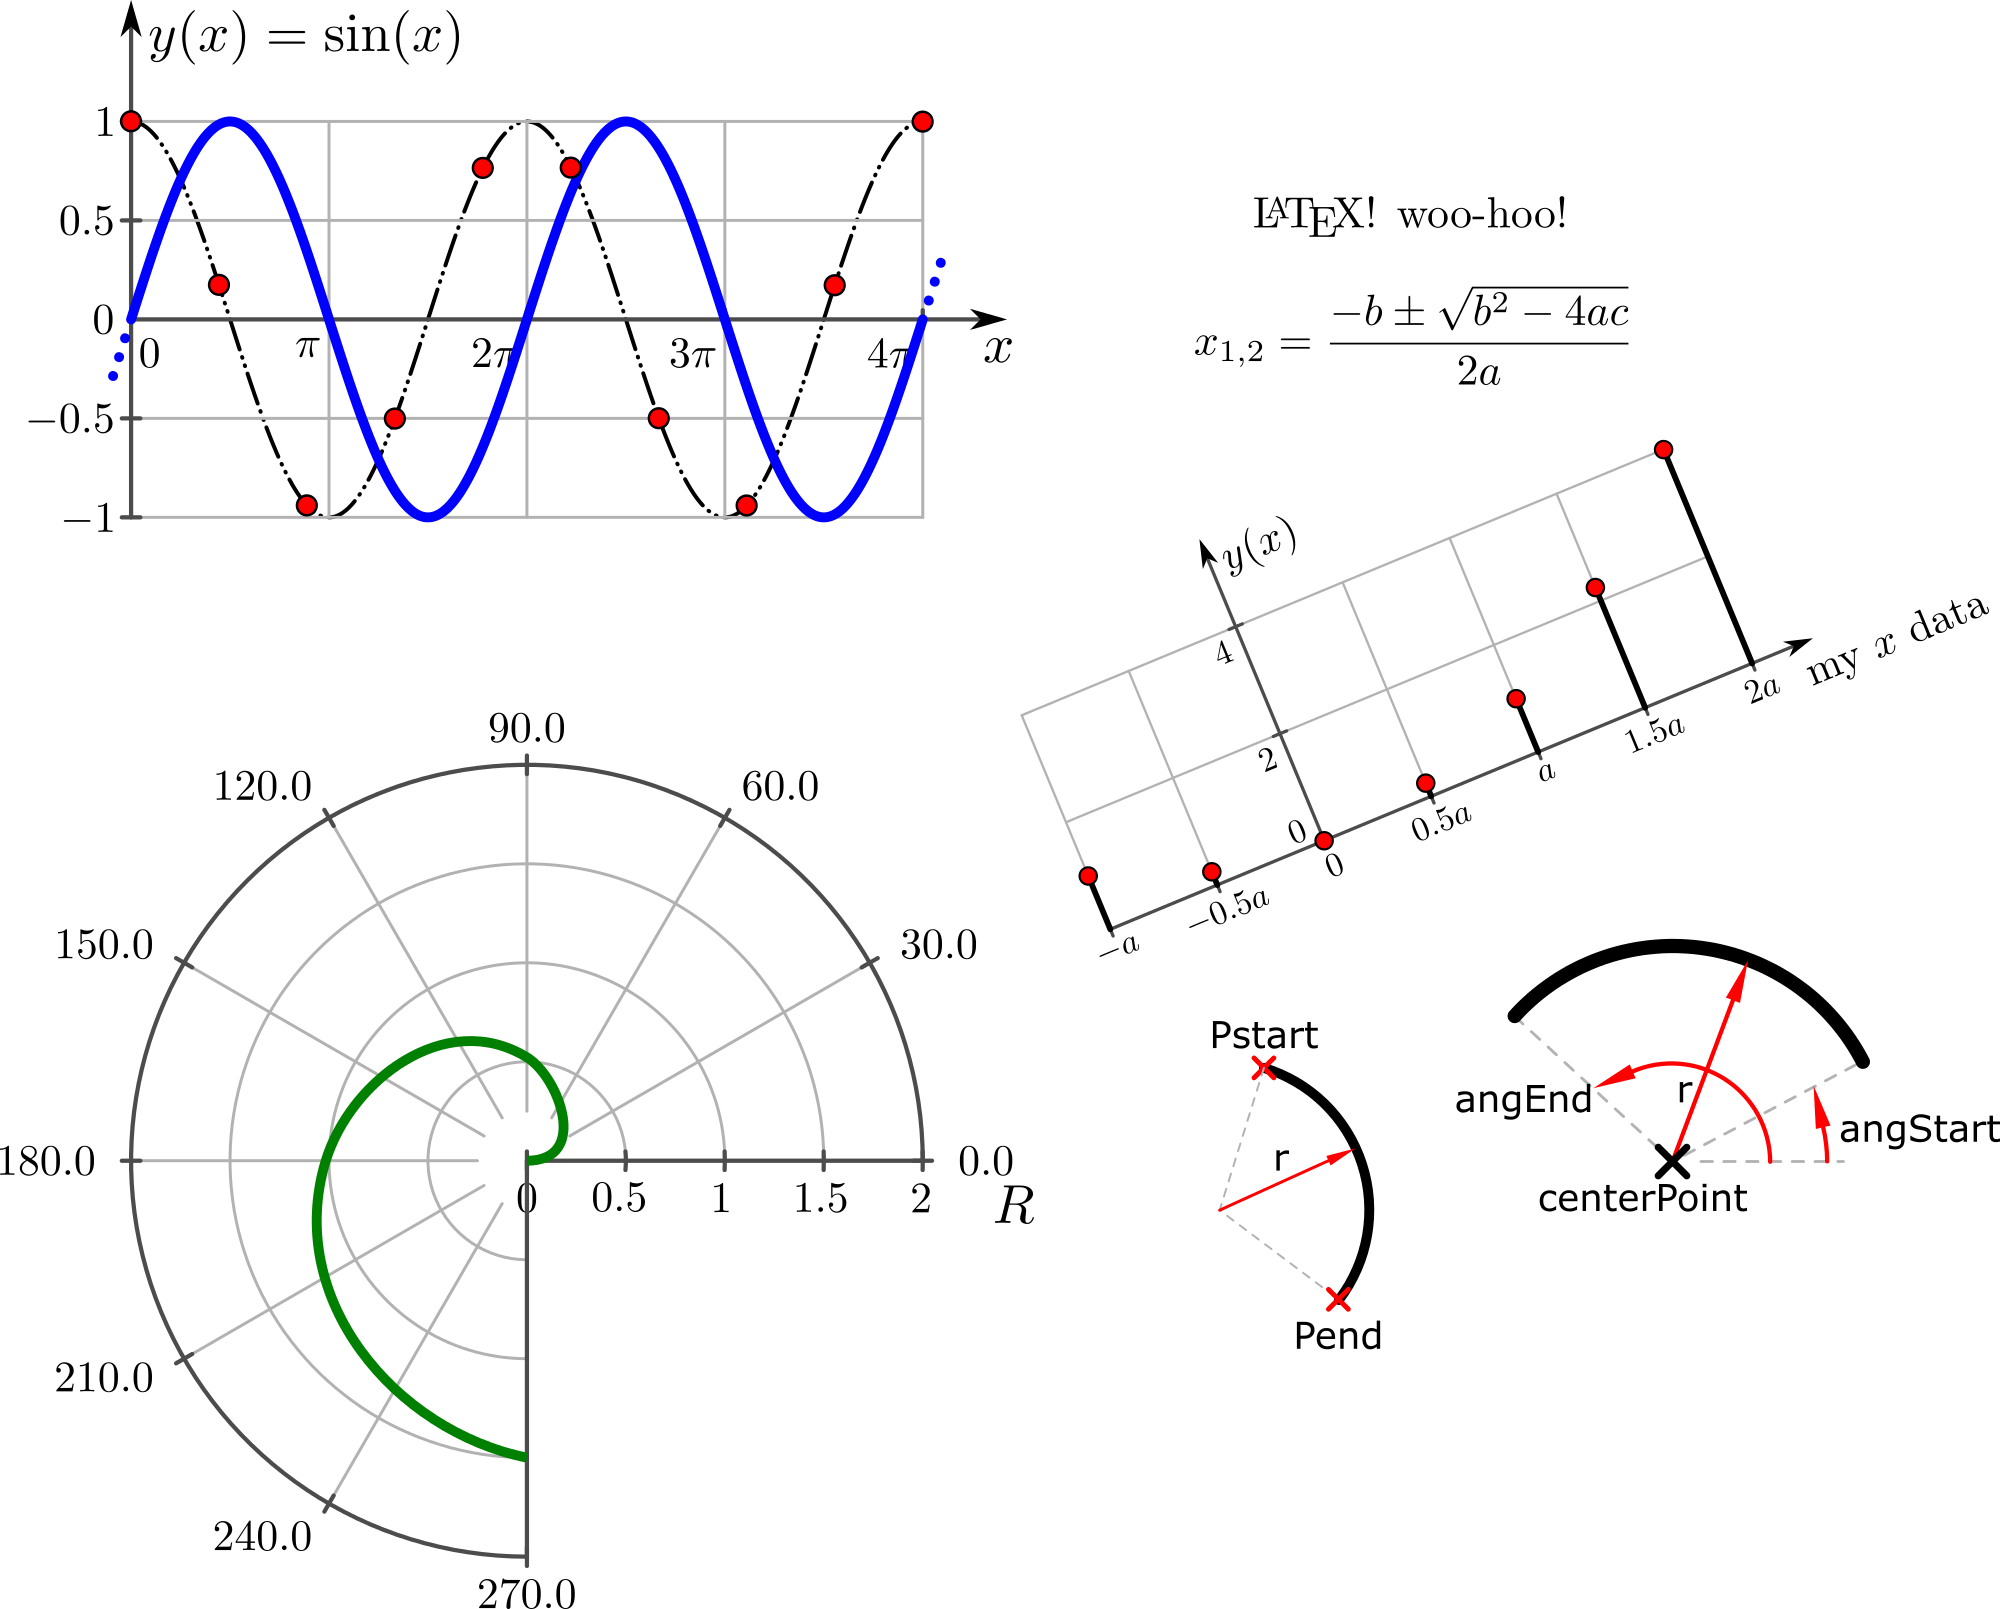
Here you will find methods and classes to deal with drawings, styles, markers, texts, plots, etc. It is a work-in-progress project and new features will be added in the future. However, there is no roadmap right now.
Current and older versions
Version compatibility table |
||
|---|---|---|
Inkscape |
InkscapeMadeEasy |
Receive updates? |
1.0 |
1.0 (latest) |
YES |
0.48, 0.91, 0.92 |
0.9x (obsolete) |
NO |
Current version
The current version of InkscapeMadeEasy is 1.0. This version is compatible with Inkscape 1.0 and up only. It is incompatible with older Inkscape versions!
Note
This documentation page refers to version 1.0
Older versions
If you have an older version of Inkscape, please use InkscapeMadeEasy 0.9x. The files are under the folder 0.9x on github. In this folder you can also find a pdf with the manual of this obsolete version. Follow the installation instructions in the pdf.
Warning
Only the latest version will receive updates, new features, and bug fixes.
Usage
InskcapeMadeEasy is not an end-user Inkscape extension by itself. The objective is to provide easier backstage functions and modules to facilitate the development of Inkscape extensions.
For end-user extensions that employ InskcapeMadeEasy, please refer to my other repositories on GitHub (more to come soon). They provide many examples of how to use inkscapeMadeEasy:
createMarkers <https://github.com/fsmMLK/inkscapeCreateMarkers>
cartesianAxes2D <https://github.com/fsmMLK/inkscapeCartesianAxes2D>
cartesianPlotFunction2D <https://github.com/fsmMLK/inkscapeCartesianPlotFunction2D>
cartesianPlotData2D <https://github.com/fsmMLK/inkscapeCartesianPlotData2D>
cartesianStemPlot <https://github.com/fsmMLK/inkscapeCartesianStemPlot>
polarAxes2D <https://github.com/fsmMLK/inkscapePolarAxes2D>
logicGates <https://github.com/fsmMLK/inkscapeLogicGates>
circuitSymbols <https://github.com/fsmMLK/inkscapeCircuitSymbols>
wavedromScape <https://github.com/fsmMLK/wavedromScape>
dimensions <https://github.com/fsmMLK/inkscapeDimensions>
SlopeField <https://github.com/fsmMLK/inkscapeSlopeField>
BodePlot <https://github.com/fsmMLK/inkscapeBodePlot>
Spirograph <https://github.com/fsmMLK/inkscapeSpirograph>
History and Objectives
Historically, this project started as a way to help myself while creating extensions, namely focusing on scientific/academic diagrams and graphs. In the academy, we prepare plots and diagrams very often to explain concepts or results for lectures, seminars, congresses and scientific articles.
There are many consecrated mathematical tools that can produce them, e.g., Gnuplot, Octave, Matlab, R, etc. They all can produce nice plots. However, it might be a little cumbersome when we want to add other elements to these plots, like text, comments, arrows, etc. These packages have tools to do it but they are cumbersome to use. A better approach would be using proper graphic software.
One possible approach is to export these plots as raster images and use raster graphic software to produce the annotations, like Gimp. I prefer to have the plots in a vector graphic format to be able to produce, if needed, raster images with different resolutions without the fear of having a heavily pixelated image. For this, Inkscape is very sound.
Unfortunately, exporting plots as vector graphics is not always successful in the sense that the resulting document is quite “dirty” (unorganized groups, isolated elements, etc.). Therefore I decided to make my plotting/diagram tools for Inkscape.
In the process of creating these tools, I noticed that many of the low-level classes and methods used to manipulate elements of the svg file could be grouped in a general-purpose set of core modules that extended inkex.py module. inkscapeMadeEasy was born! The core modules I created do not intend to provide an extensive array of methods and classes to cover all possibilities of manipulations/transformations, and drawing. These modules were created and expanded as I felt the necessity to have new methods to help my workflow. Nevertheless, the number of methods created allows many possibilities and is still under development so new features can (will) appear in future versions.
Obs: Since it is not very easy to find documentation of other Inkscape modules, there might be other modules with similar/better features that I was not aware of when I was producing my extensions.
Enough mumbo-jumbo. Let’s start! =D
Main Features
Installation
General gist and minimal example
Module Definitions
Changelog
- Changelog
- 2024-04apr-18
- 2022-10oct-01
- 2022-08aug-19
- 2022-02feb-19
- 2021-09sep-12
- 2021-04apr-28
- 2021-04apr-25
- 2021-04apr-04
- 2021-03mar-20
- 2020-10oct-06
- 2020-10oct-02
- 2020-01jan-12
- 2020-01jan-11
- 2020-01jan-05
- 2020-01jan-02
- 2019-12dec-29
- 2019-12dec-22
- 2019-12dec-17
- 2019-04apr-04
- 2018-11nov-14
- 2018-07jul-31
- 2017-11nov-19
- 2017-08aug-04
- 2017-05may-18
- 2017-05may-06
- 2017-06jun-18
- 2016-11nov-02
- 2016-11nov-02
- 2016-10oct-31
- 2016-10oct-28
- 2016-10oct-12
- 2016-09sep-21